Diagnose PostgreSQL slow queries

This walkthrough uses the Pigsty sandbox and dashboards from February 2021.
Slow queries occupy connections, hold locks, and consume CPU and I/O. On a standby, a long query can conflict with WAL replay. PostgreSQL can delay replay or cancel the conflicting query, depending on its standby settings. See hot standby conflicts.
Monitoring helps you find the affected query and compare its behavior before and after a change.
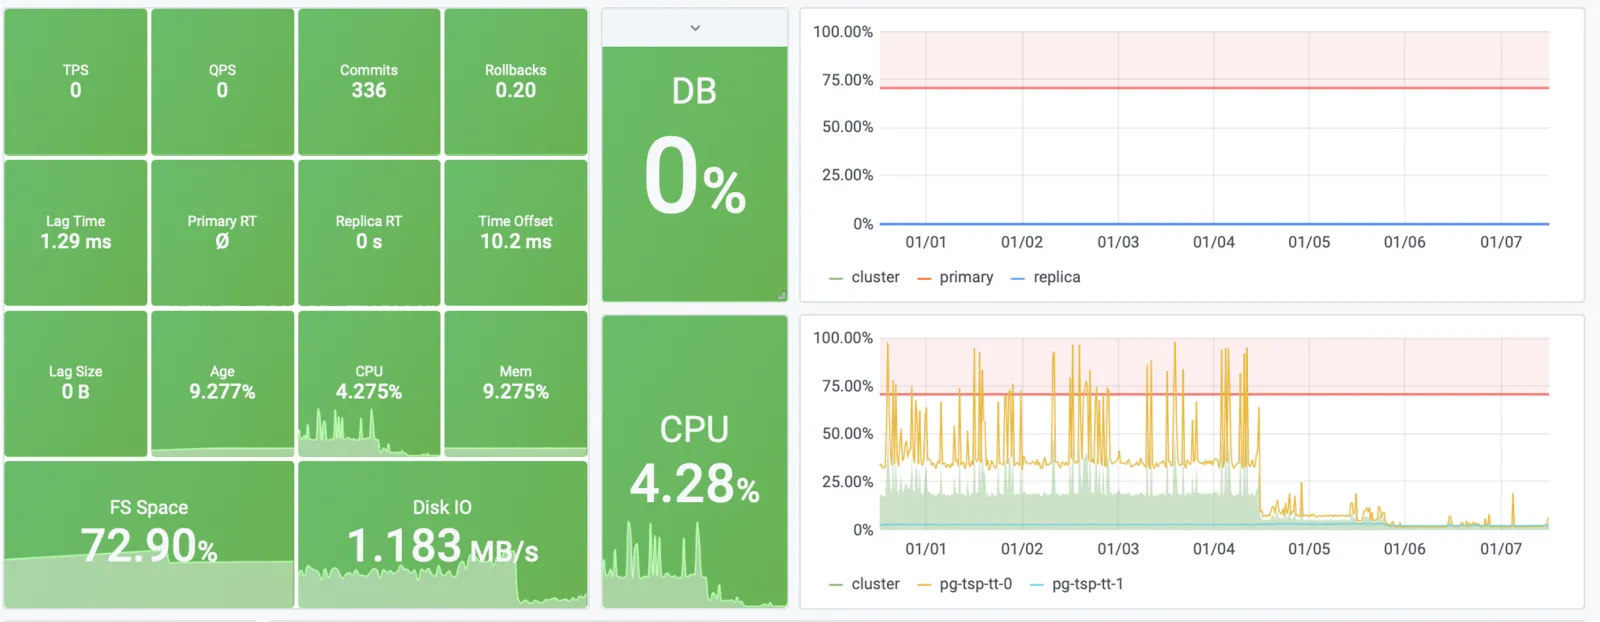
In this example, query optimization reduced CPU use from about 40% to 4%.
Collect query statistics and logs
The pg_stat_statements extension groups similar statements. It records call counts, execution times, rows retrieved or affected, and I/O statistics. To enable it:
- Add
pg_stat_statementstoshared_preload_libraries. - Restart PostgreSQL.
- Run
CREATE EXTENSION pg_stat_statementsin the database where you will read the statistics.
A query ID identifies a normalized statement. It does not identify one execution or guarantee one execution plan. Column names vary by PostgreSQL version; use the matching pg_stat_statements reference.
Use log_min_duration_statement to log statements whose duration reaches a threshold. These logs help explain individual slow executions. Choose the threshold for the workload: logging every statement increases log volume and collection overhead.
A cumulative average can hide a recent regression. Take repeated samples to compare response time, call rate, and I/O over the incident interval. A slow-query threshold should reflect the application’s latency requirement. A frequent point lookup and an occasional batch query need different thresholds.
Reproduce the problem in a sandbox
This experiment deliberately removes an index. Run it in a disposable pgbench database.
The historical Pigsty sandbox used make ri, make ro, and make rw to initialize and exercise the pg-test cluster. The following commands apply write and read loads through its service ports:
Run each load in its own terminal. On the primary, remove the primary key:
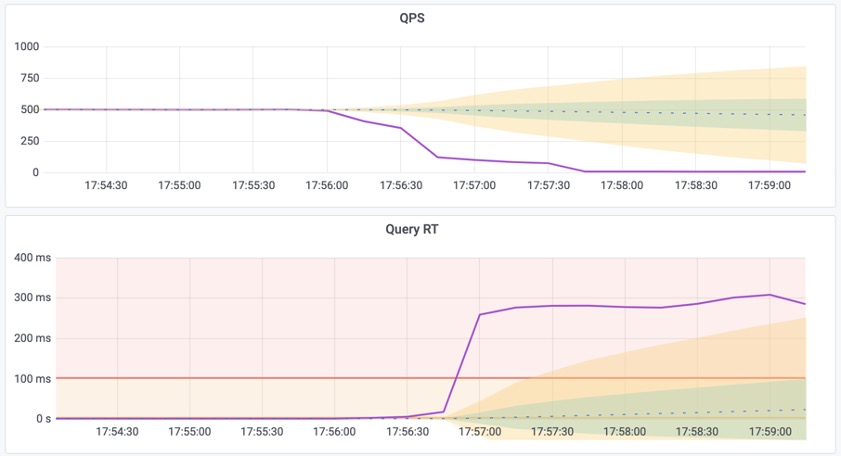
The point lookup loses its index. In this test, average response time increased from about 1 ms to 300 ms. One replica’s QPS fell from 500 to 7.
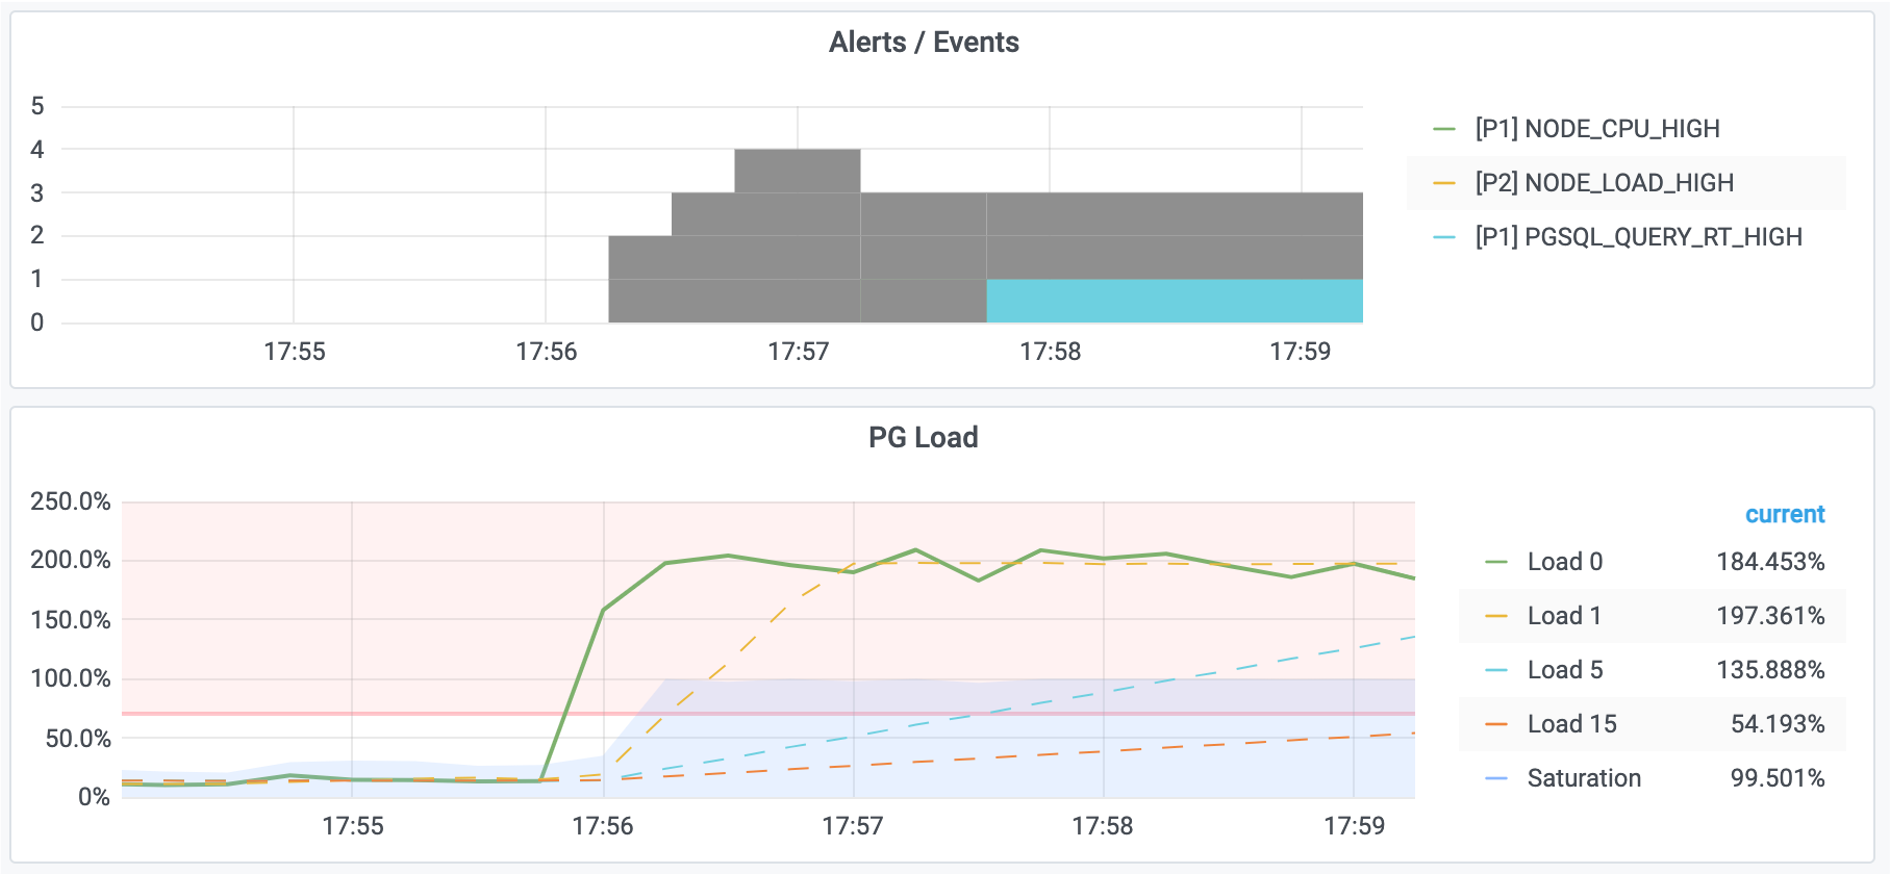
The cluster load also increased and triggered alerts.
Find the query
Open PG Cluster to identify the affected instance. In PG Query, look for statements whose response time and share of execution time increased.
In this example, query ID -6041100154778468427 changed from about 17 μs to 280 ms, while its QPS fell from 500 to 7.
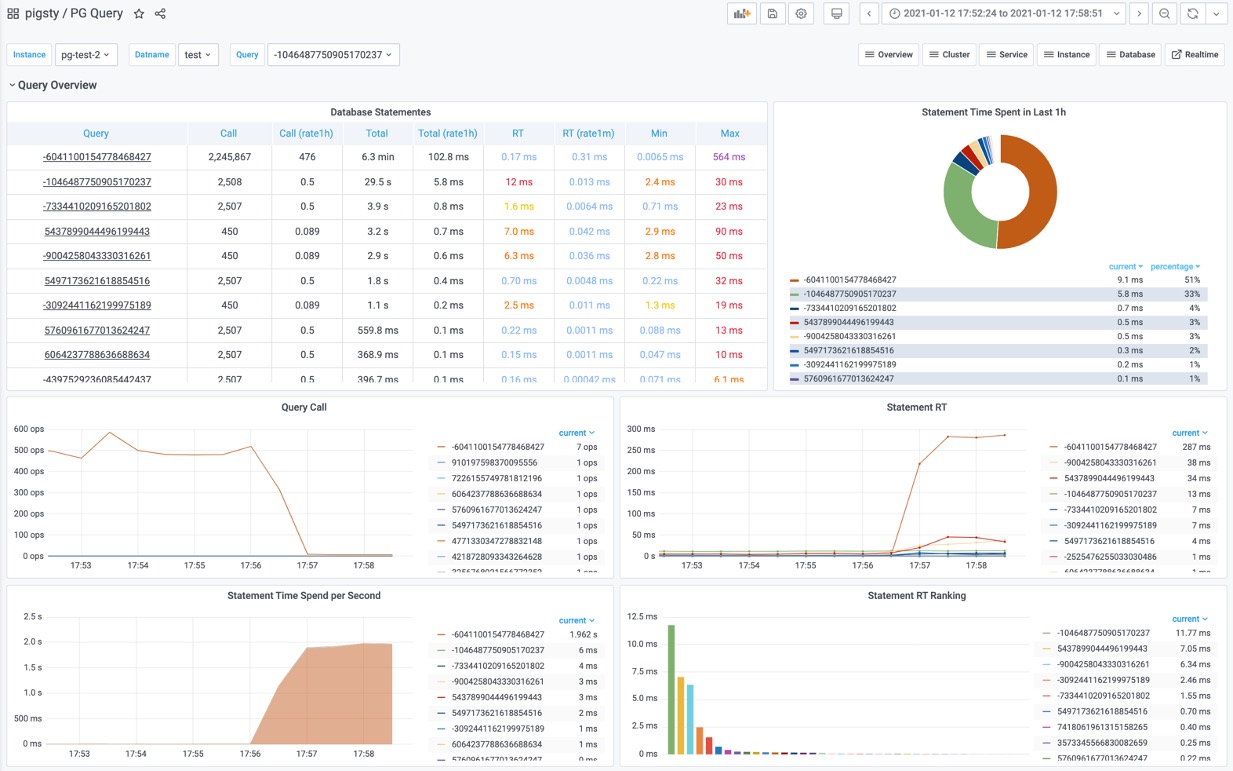
Open PG Query Detail for this query ID to find the SQL:

Test the cause
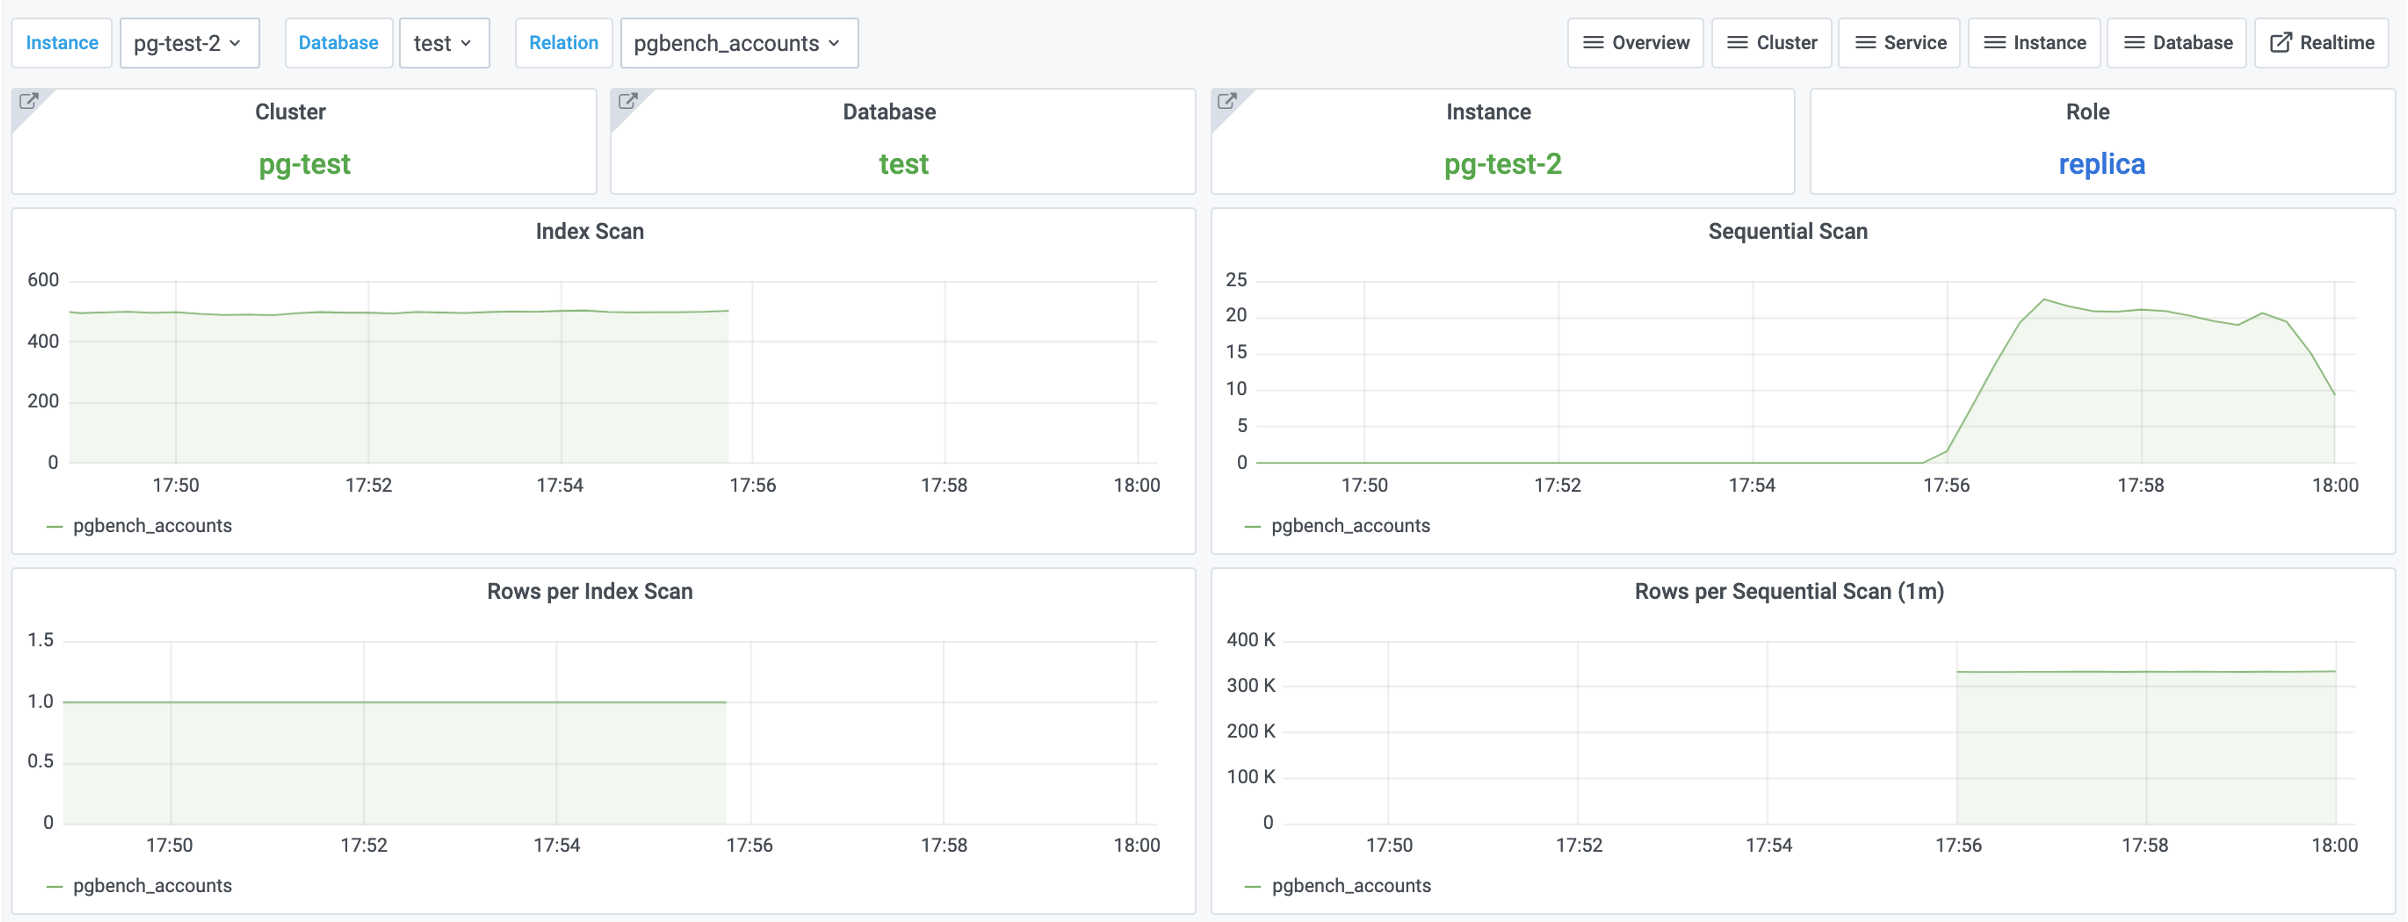
The statement retrieves one account by aid. In PG Table Catalog, check whether that column has an index. In PG Table Detail, compare index scans and sequential scans on pgbench_accounts.
In this experiment, index scans fell to zero and sequential scans increased after the primary key was removed. This supports the missing-index diagnosis.
Apply and verify the fix
Restore an index on aid in the sandbox:
This restores the lookup path. It does not recreate the primary-key constraint removed earlier.
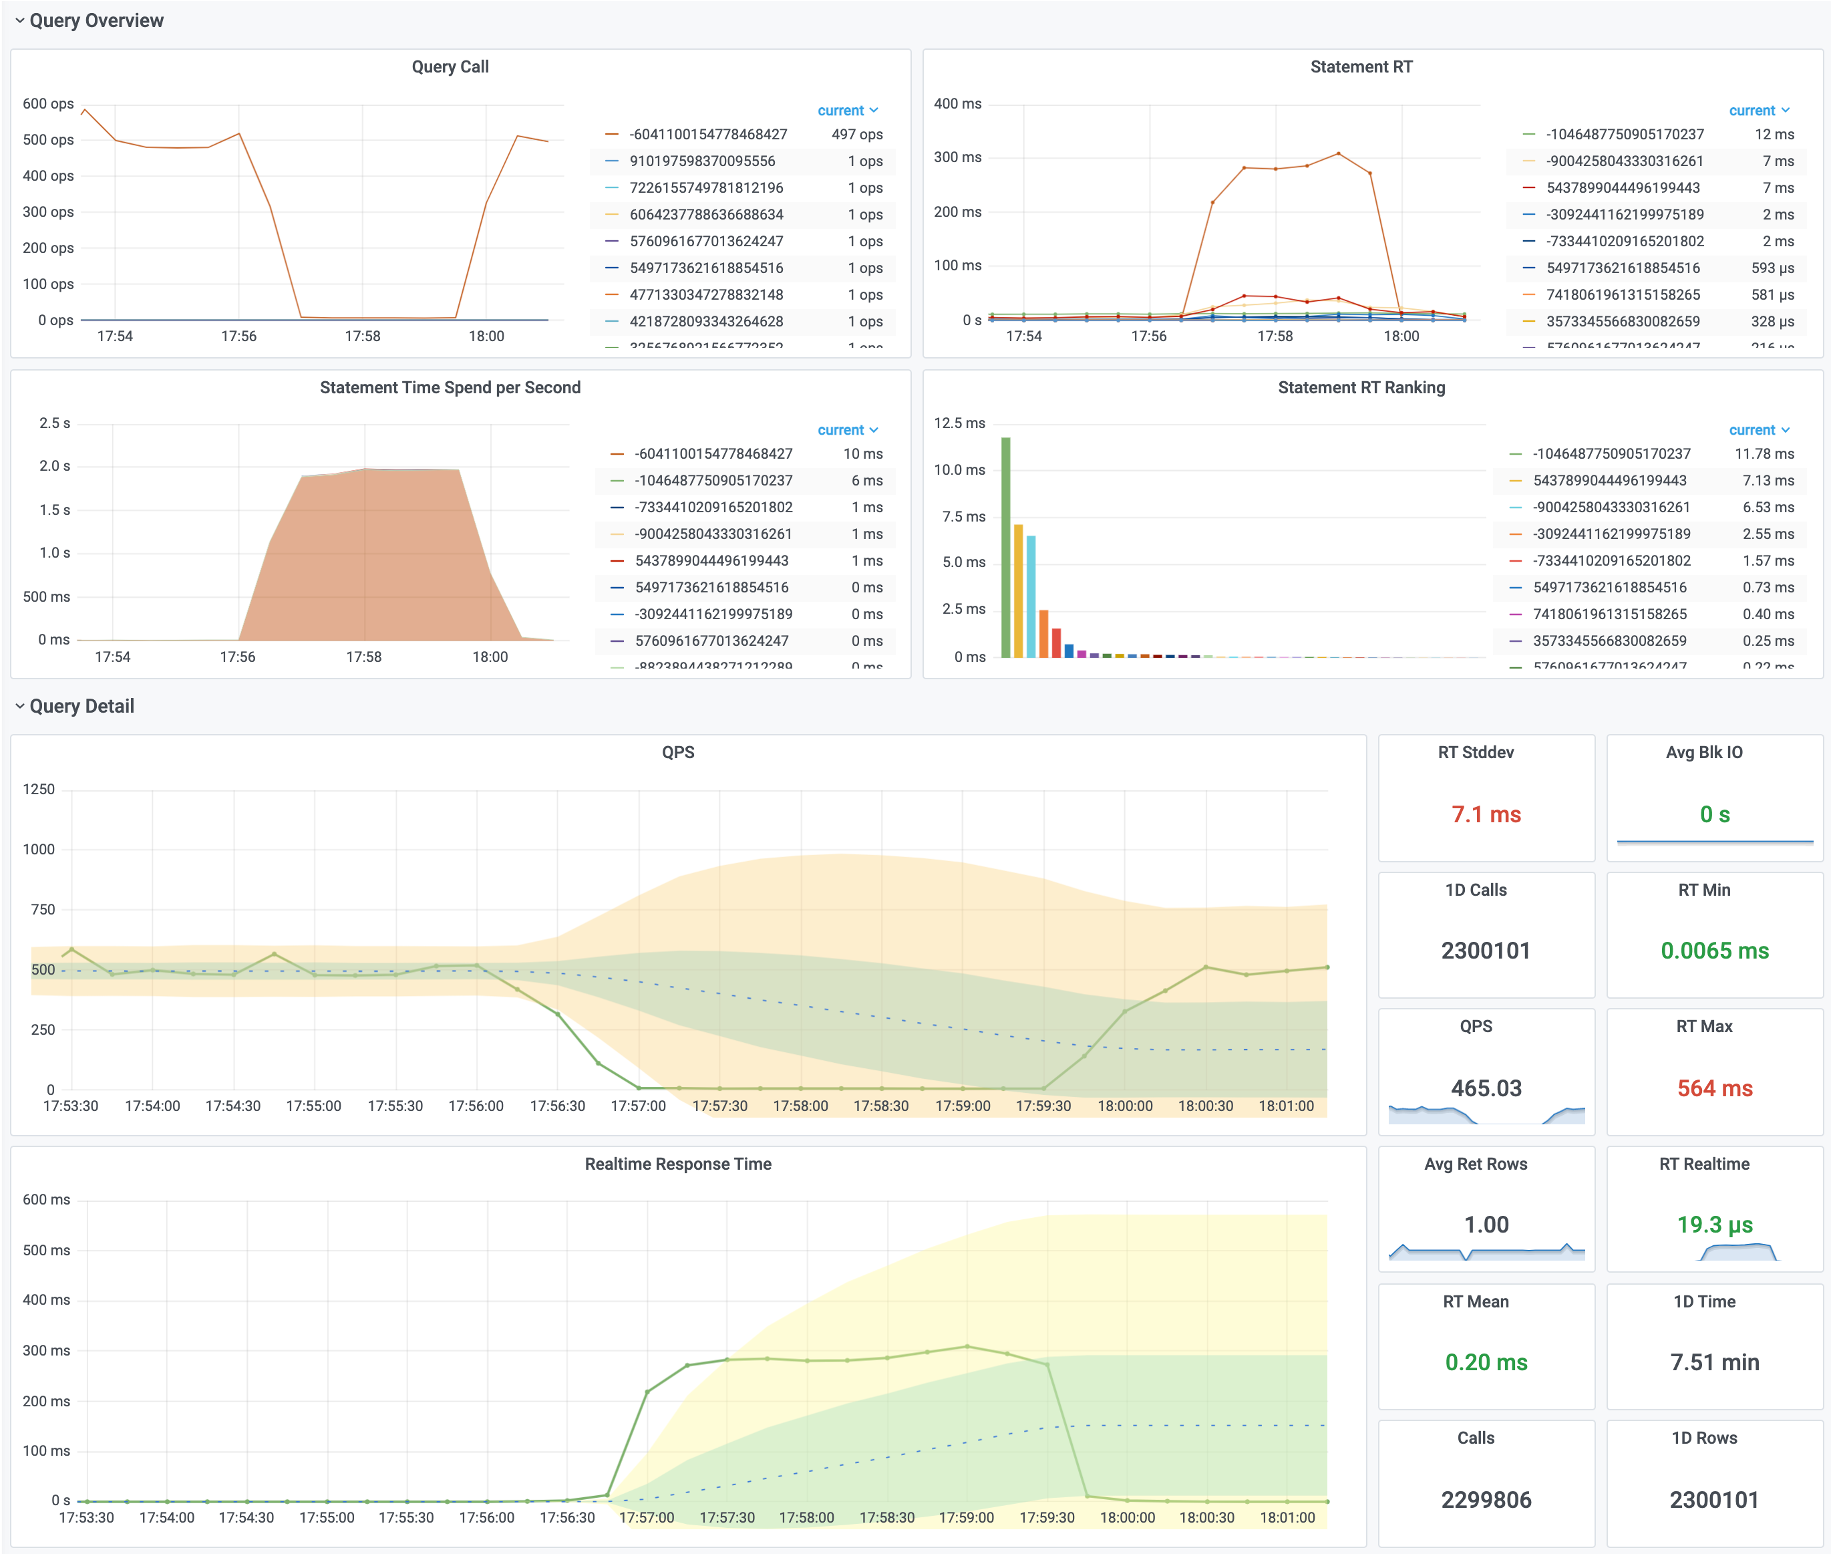
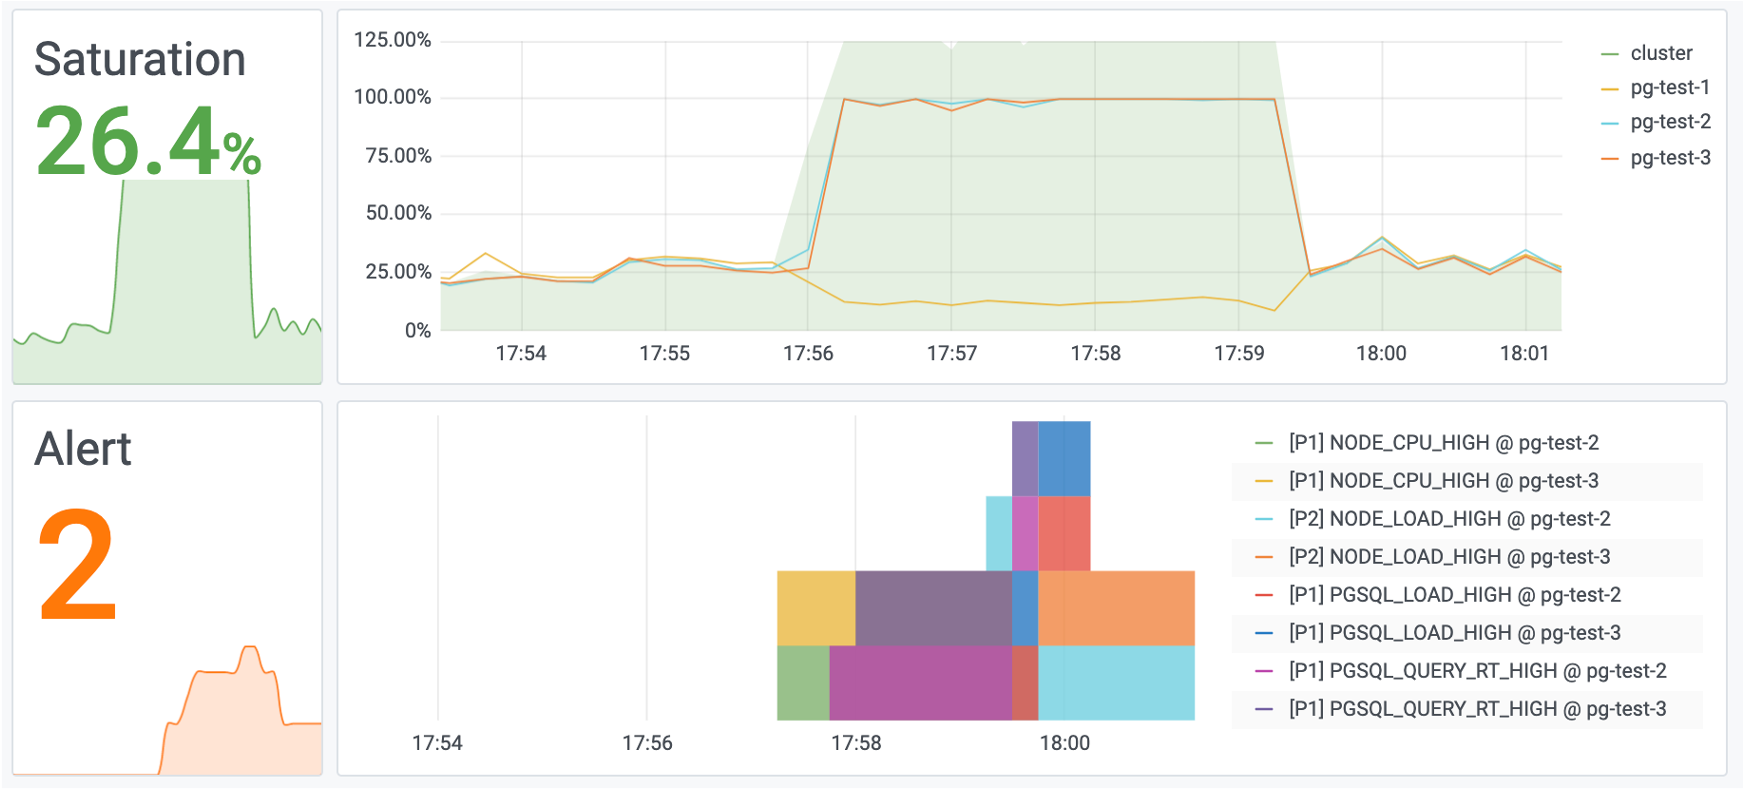
Compare the same workload and time intervals before and after the change. Record query latency, throughput, and resource use. Stop the test load when the experiment is complete.