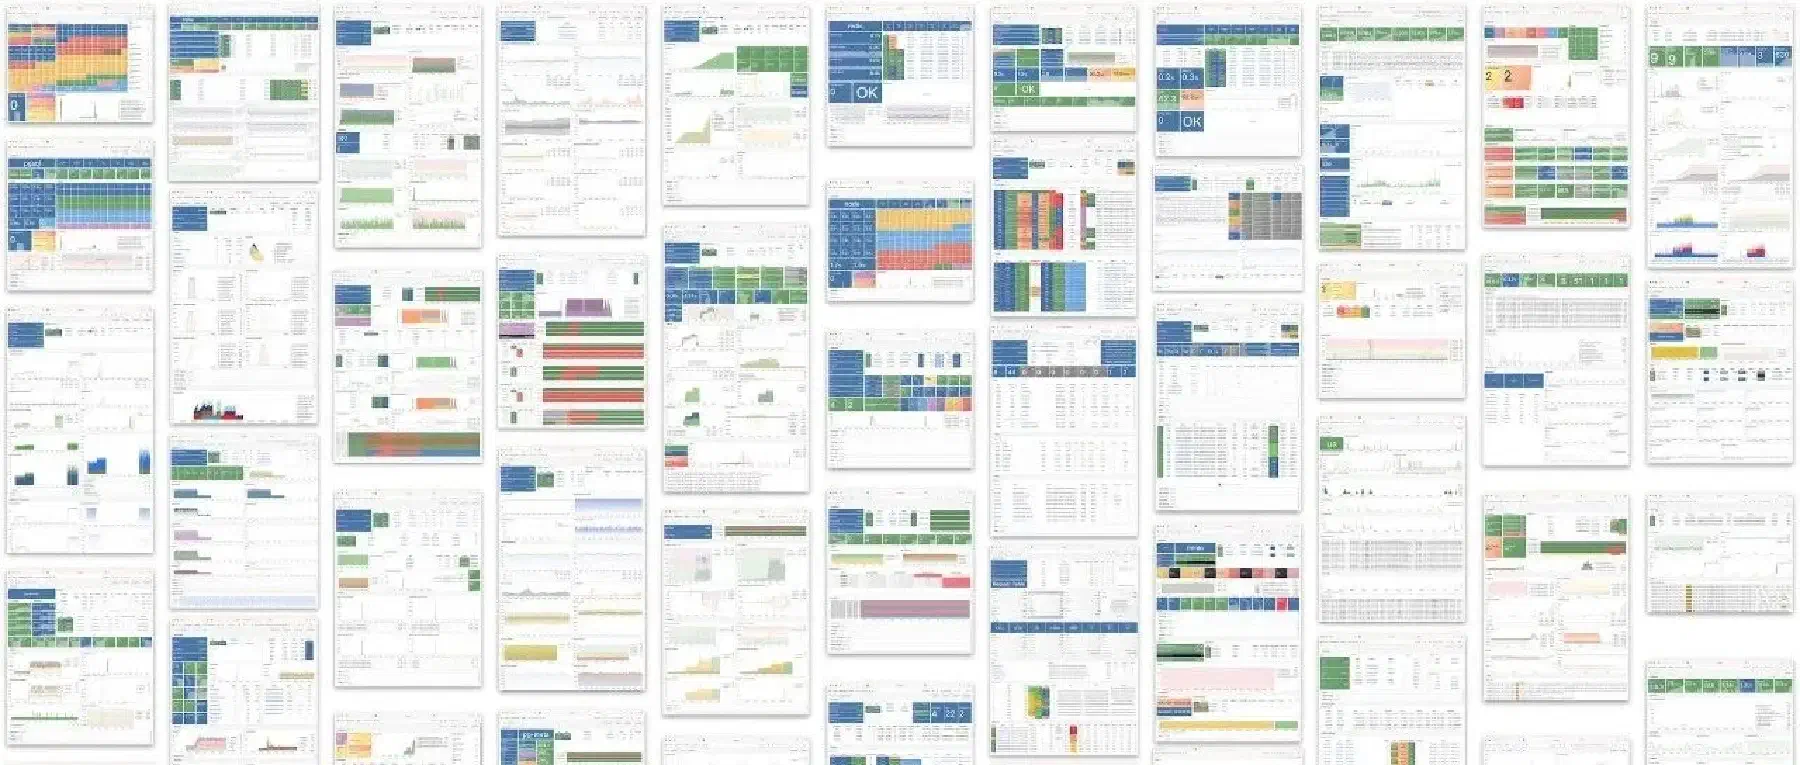
Monitor Existing PostgreSQL with Pigsty: RDS, PolarDB, and Self-Hosted Databases

This tutorial describes Pigsty and Alibaba Cloud services as used in September 2023. Commands, prices, and dashboard details reflect that period.
Pigsty is a PostgreSQL distribution. You can also use it solely to monitor PostgreSQL and hosts. This tutorial uses Alibaba Cloud as an example: install Pigsty on one ECS instance, then connect existing PolarDB and RDS for PostgreSQL databases.
Procedure
The tutorial has four steps:
- Create an ECS instance for Pigsty.
- Install the full single-node Pigsty environment on it.
- Configure the monitoring user, schemas, views, and access lists in PolarDB or RDS.
- Register the database instances with Pigsty monitoring.
At the time of writing, the example required an Alibaba Cloud account with a balance above CNY 100 for pay-as-you-go resources. The example resources cost about CNY 4 per hour.
Why add this monitoring system?
Cloud providers already offer RDS monitoring. I needed more metrics to analyze slow queries, diagnose faults, and assess capacity, so I added this system.
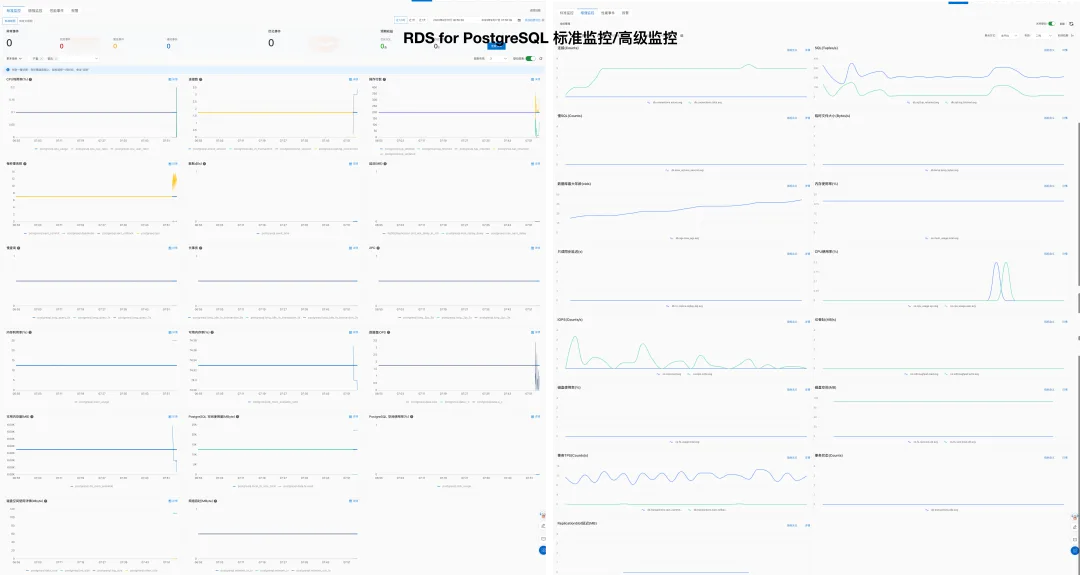
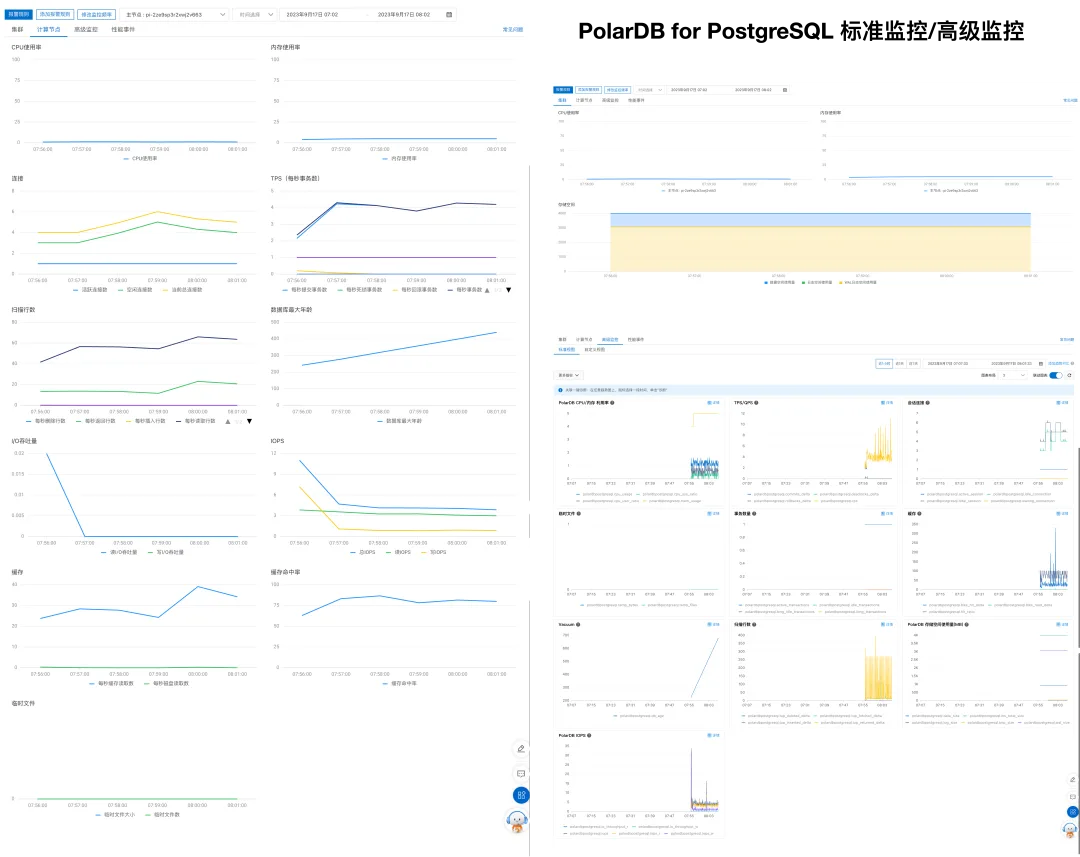
Pigsty uses Grafana and Prometheus, packaged as an INFRA module that can be installed together. Components managed by Pigsty are added to monitoring: hosts, HAProxy, PostgreSQL, PgBouncer, etcd, Redis, MinIO, and the monitoring infrastructure itself. The supplied dashboards and alert rules show system status and support troubleshooting.
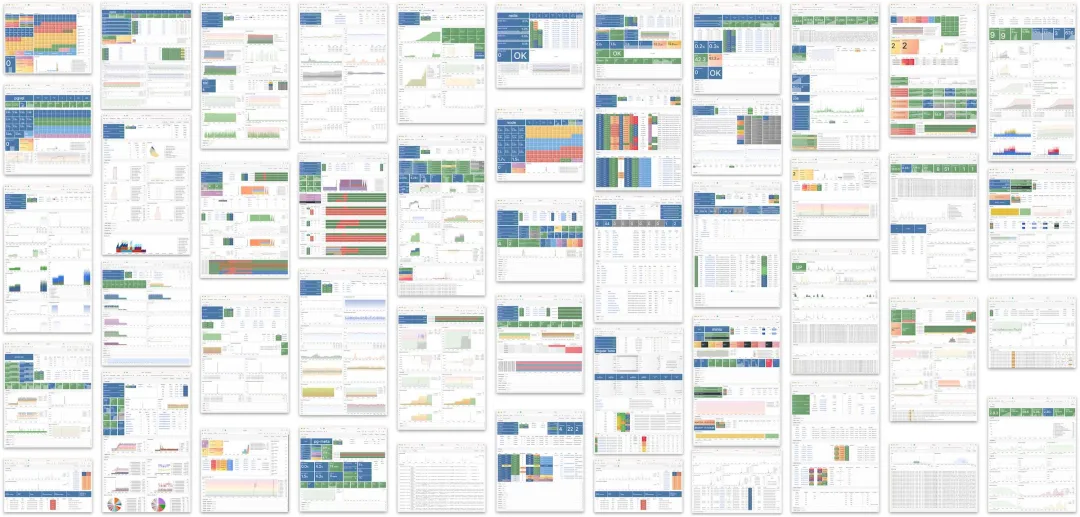
At the time of this article, a full deployment used more than 3,000 kinds of metrics for databases and supporting components. Dashboards organize the data by cluster, instance, and object. They show activity on tables, indexes, and functions, as well as cluster totals. Links switch between views; the time selector compares current activity with historical trends.
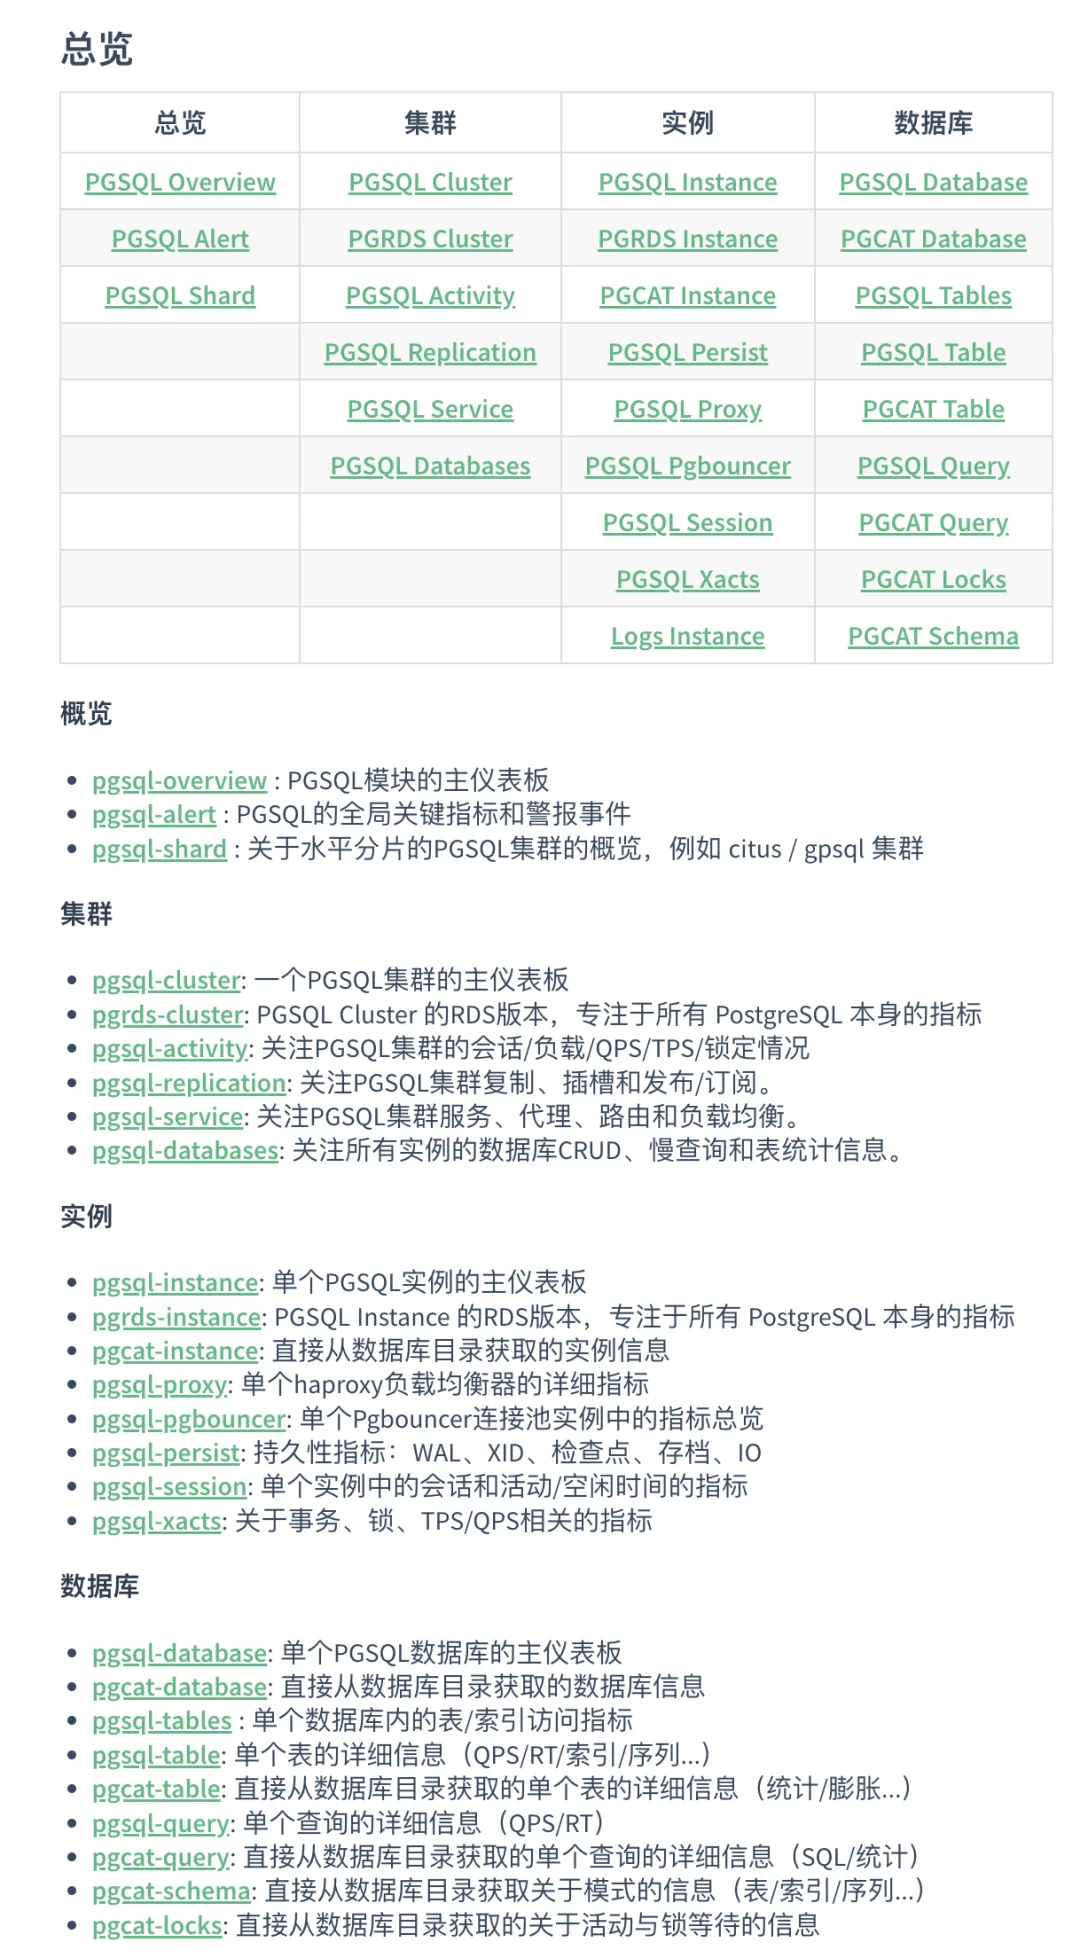
For an existing PostgreSQL database, especially a managed cloud service, available data depends on the service’s access interfaces. This setup usually lacks host, high-availability, connection-pool, and native database log data. It mainly uses PostgreSQL’s own metrics.
Explore the public demo to see the monitoring interface.
Create an ECS instance
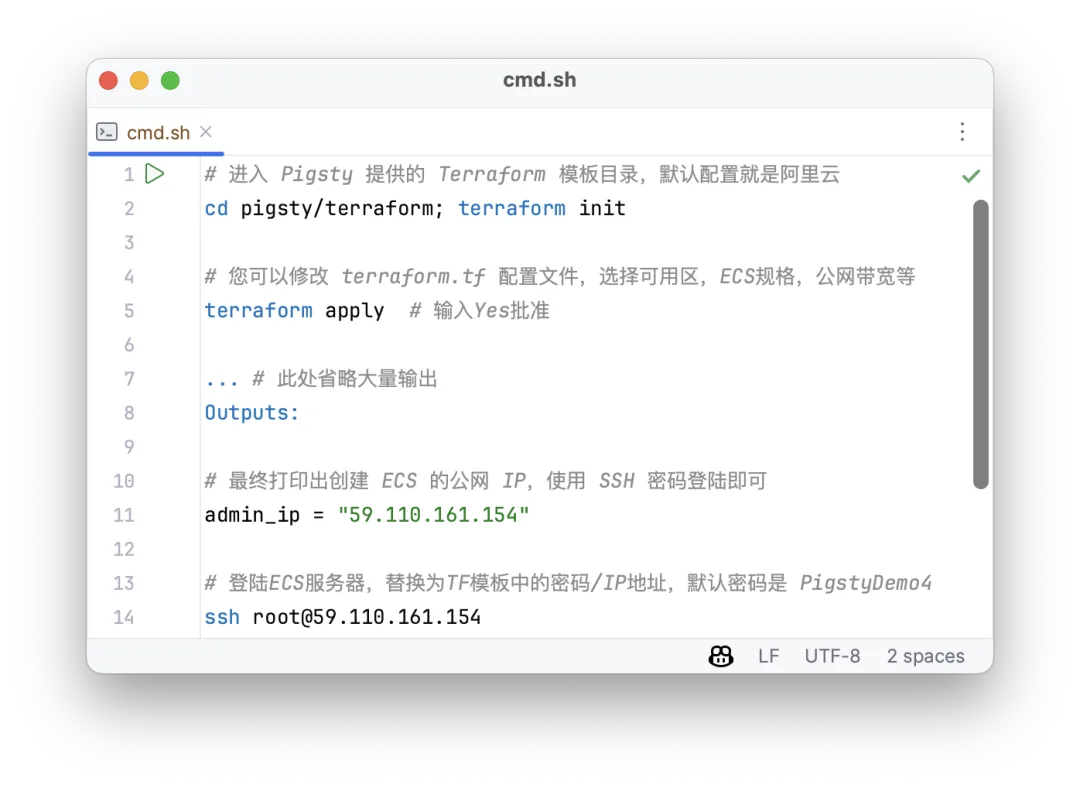
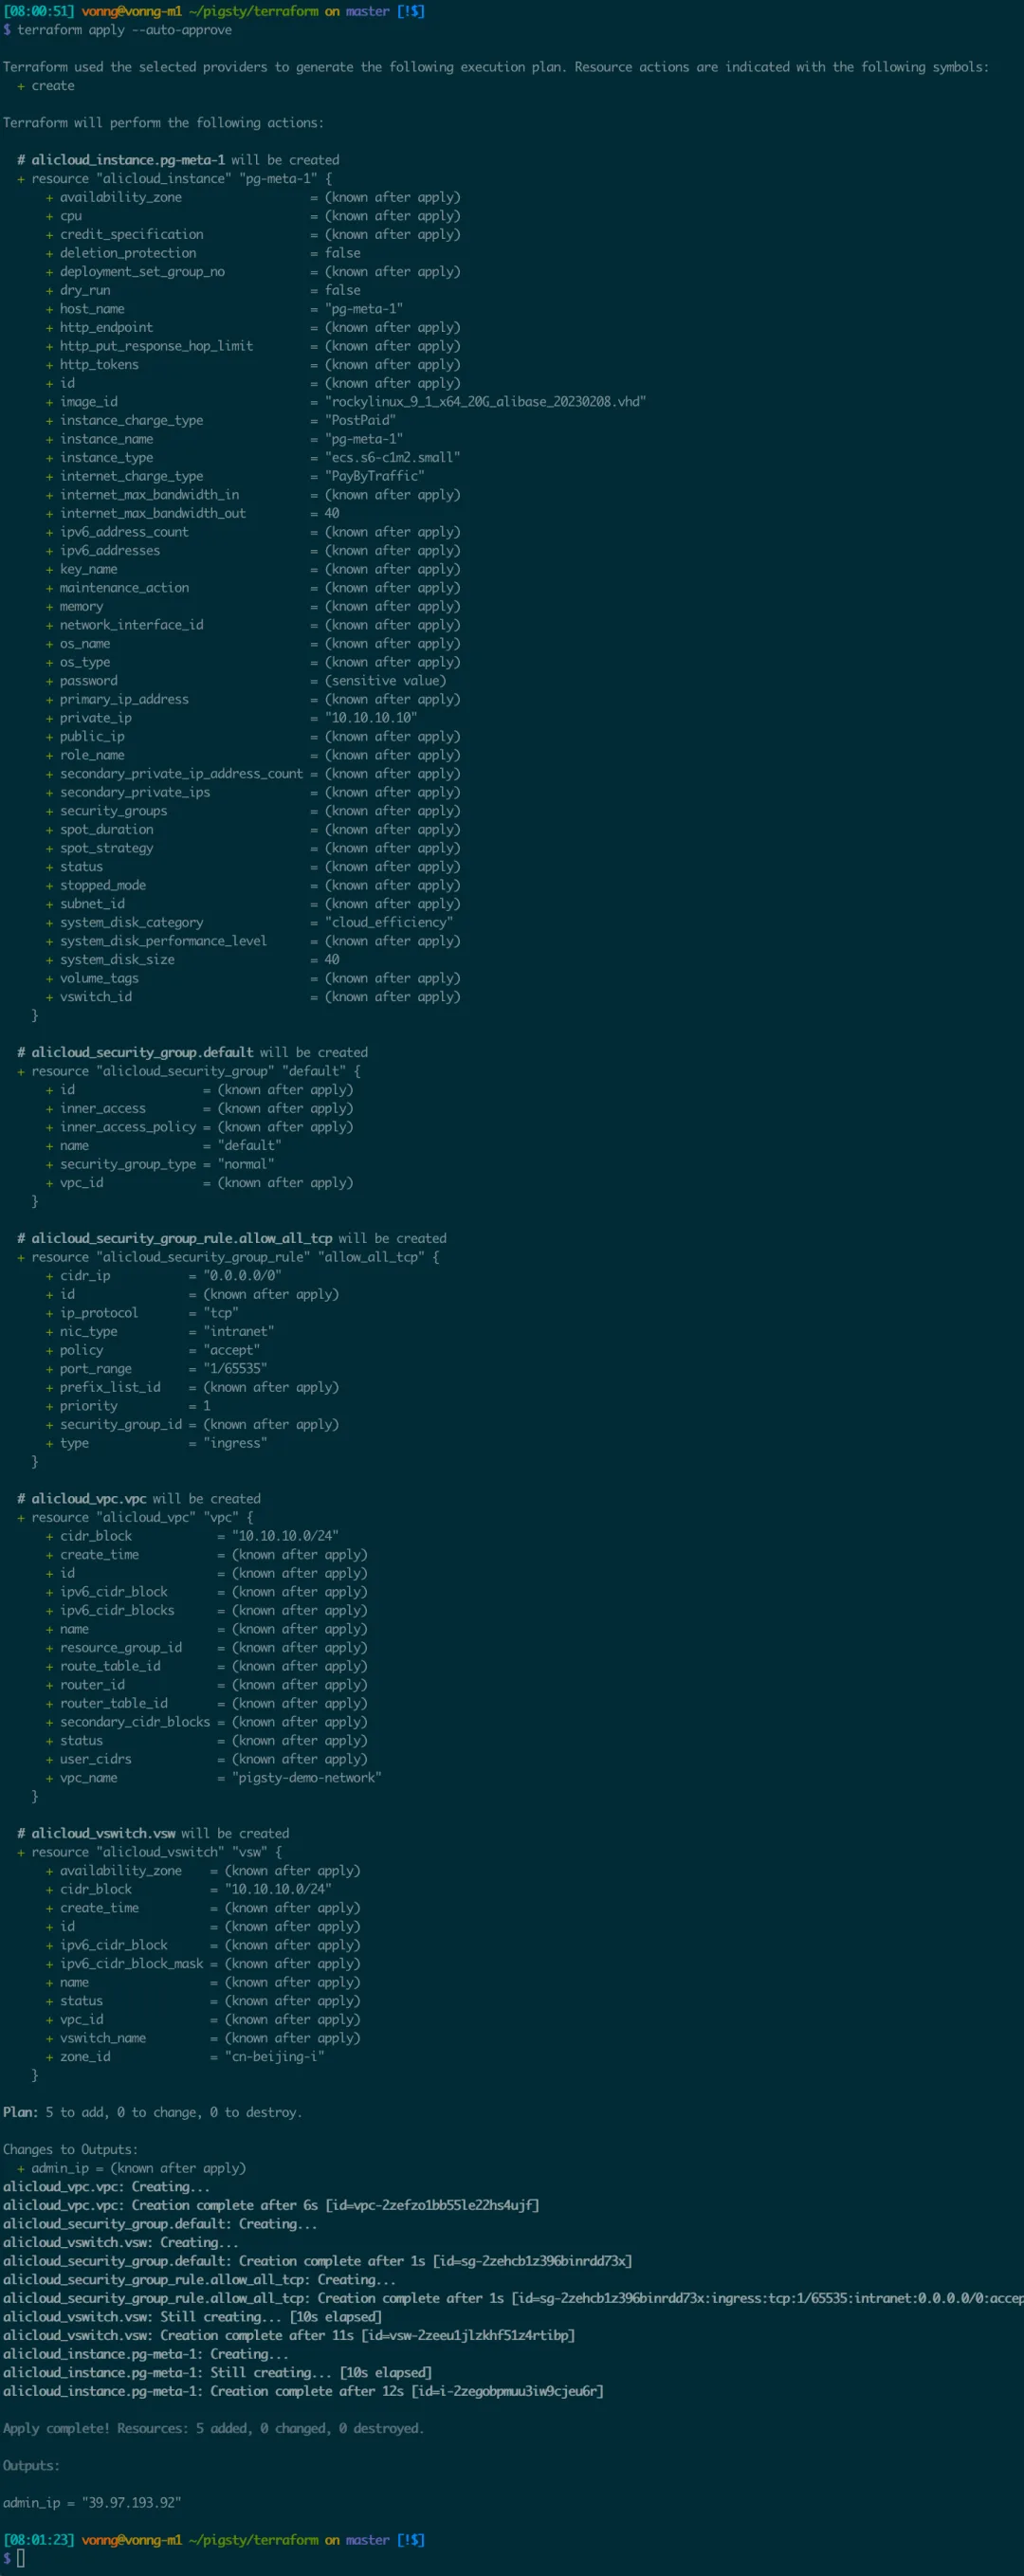
The setup shown here used an x86_64 ECS instance running EL 7–9, with Rocky Linux 8.6 or 9.1 recommended at the time. The minimum size was one CPU and 2 GB of memory. You could create it in the cloud console or use Pigsty’s Terraform template.
The demonstration template assigned the private address 10.10.10.10, the example password PigstyDemo4, and a public IP address for access.
Install single-node Pigsty on ECS
After logging in to ECS, the installation workflow was:
With the offline packages, the full installation took about ten minutes. The current procedure is in the Pigsty installation guide.
After installation, Grafana was available on port 3000 of the ECS public address. It included monitoring for the new environment itself. The example installation used the default Grafana credentials admin / pigsty.
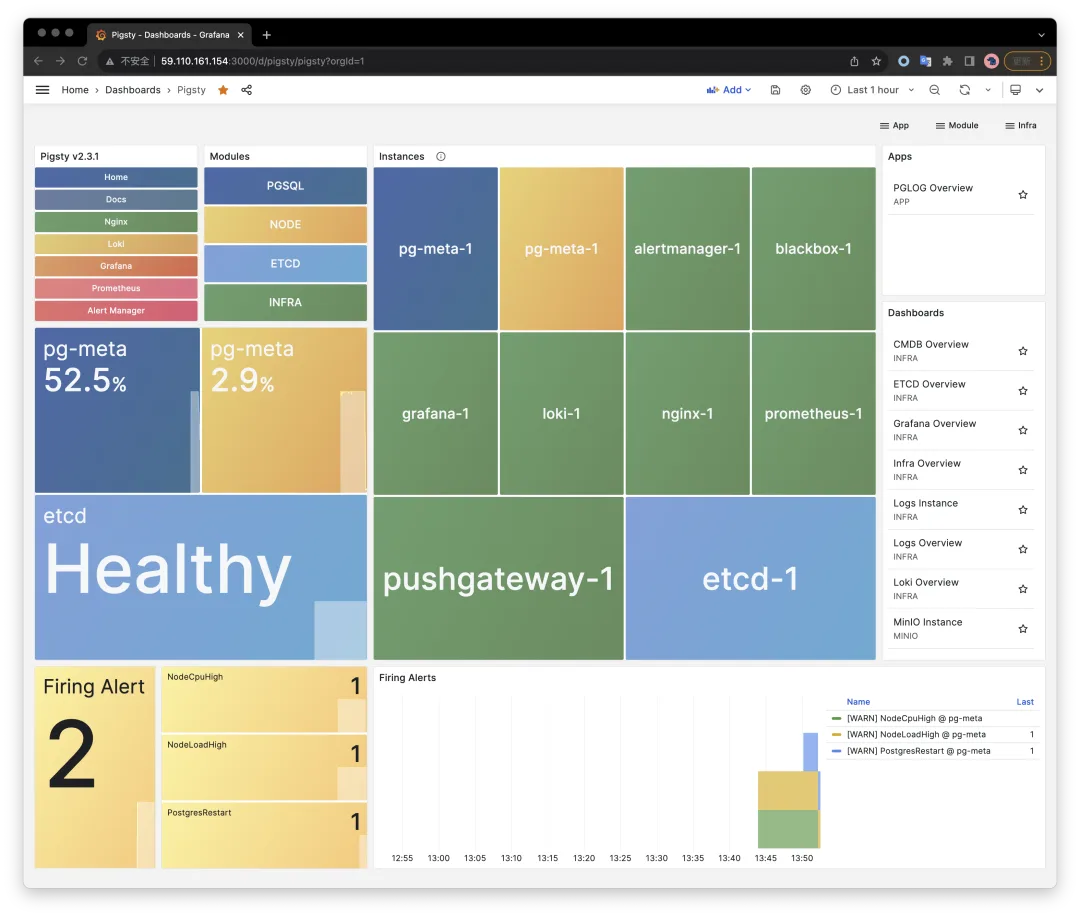
Use a domain name and HTTPS for the web interface. Replace the example passwords and restrict access to the monitoring system.
Configure PolarDB or RDS for monitoring
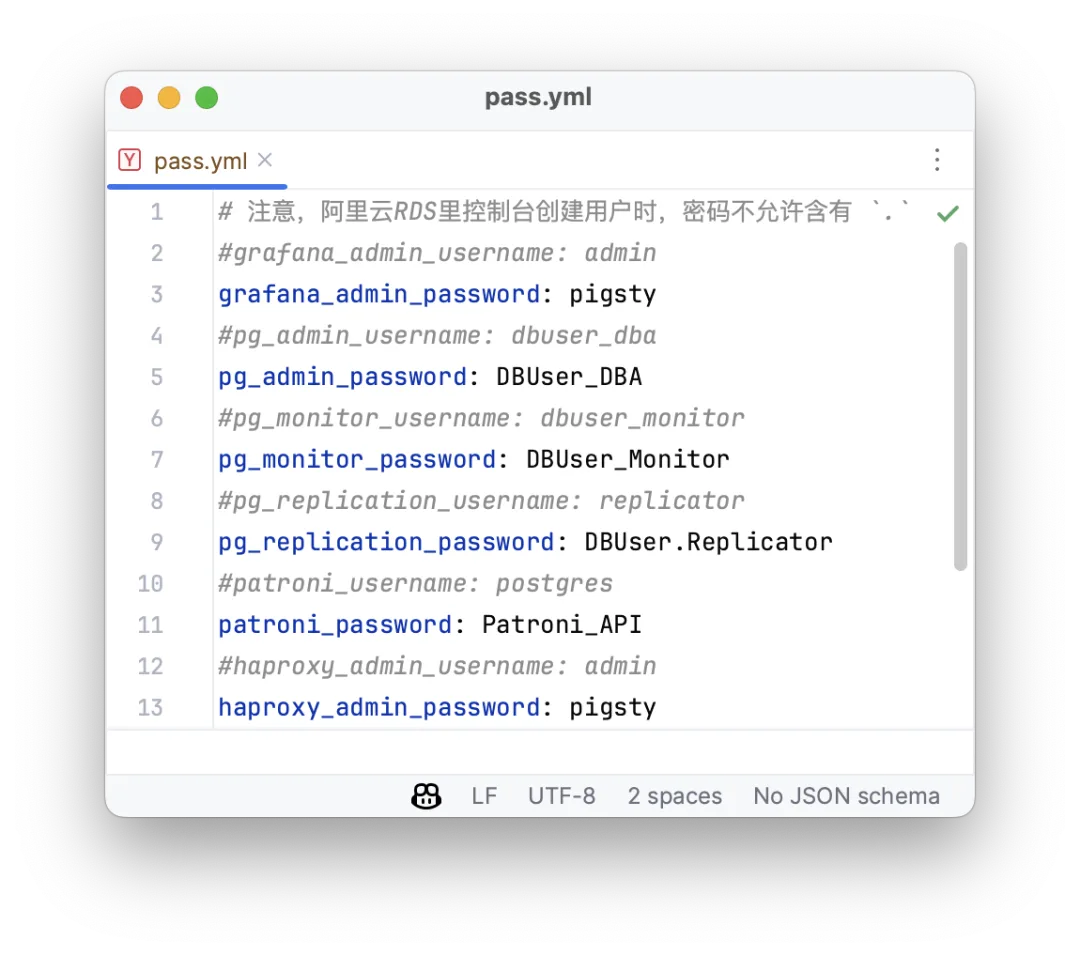
The exporter needs a connection URL that it can reach from ECS, a monitoring account with the required read permissions, and any extensions used by the selected collectors.
For the PolarDB example:
- Create the cluster in a network reachable from ECS. This example used the same availability zone and subnet.
- Create the privileged administration account
dbuser_dbafor initial configuration. - Add the ECS private address,
10.10.10.10, to the cluster access allowlist. - Create a database, named
testin this example.
Connect as the administrator to configure the monitoring role. Substitute your cluster endpoint and use a password prompt:
Create a dedicated monitoring user with this account, or create it through the cloud console.
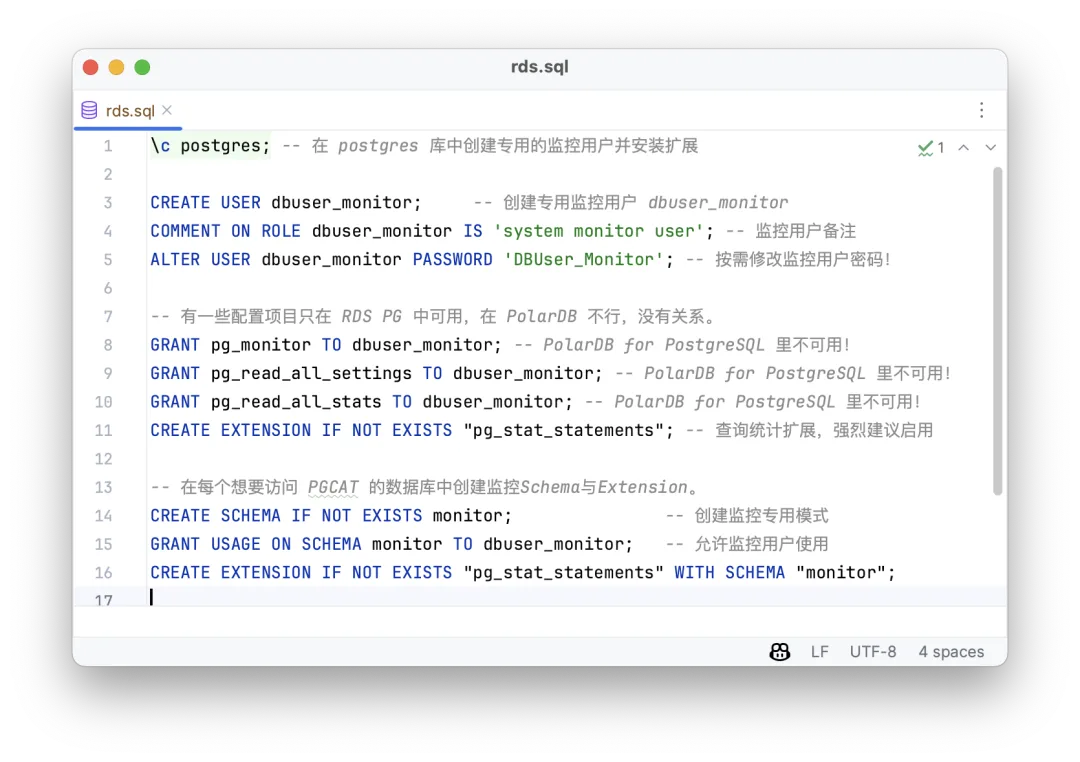
Install pg_stat_statements to collect query-level statistics, including call counts and execution time.
Register existing databases
To add RDS and PolarDB instances, provide their identities and connection settings in pigsty.yml. In the version used here, all.children.infra.vars.pg_exporters was a dictionary: each key was a unique local exporter port, and each value described a target database instance.
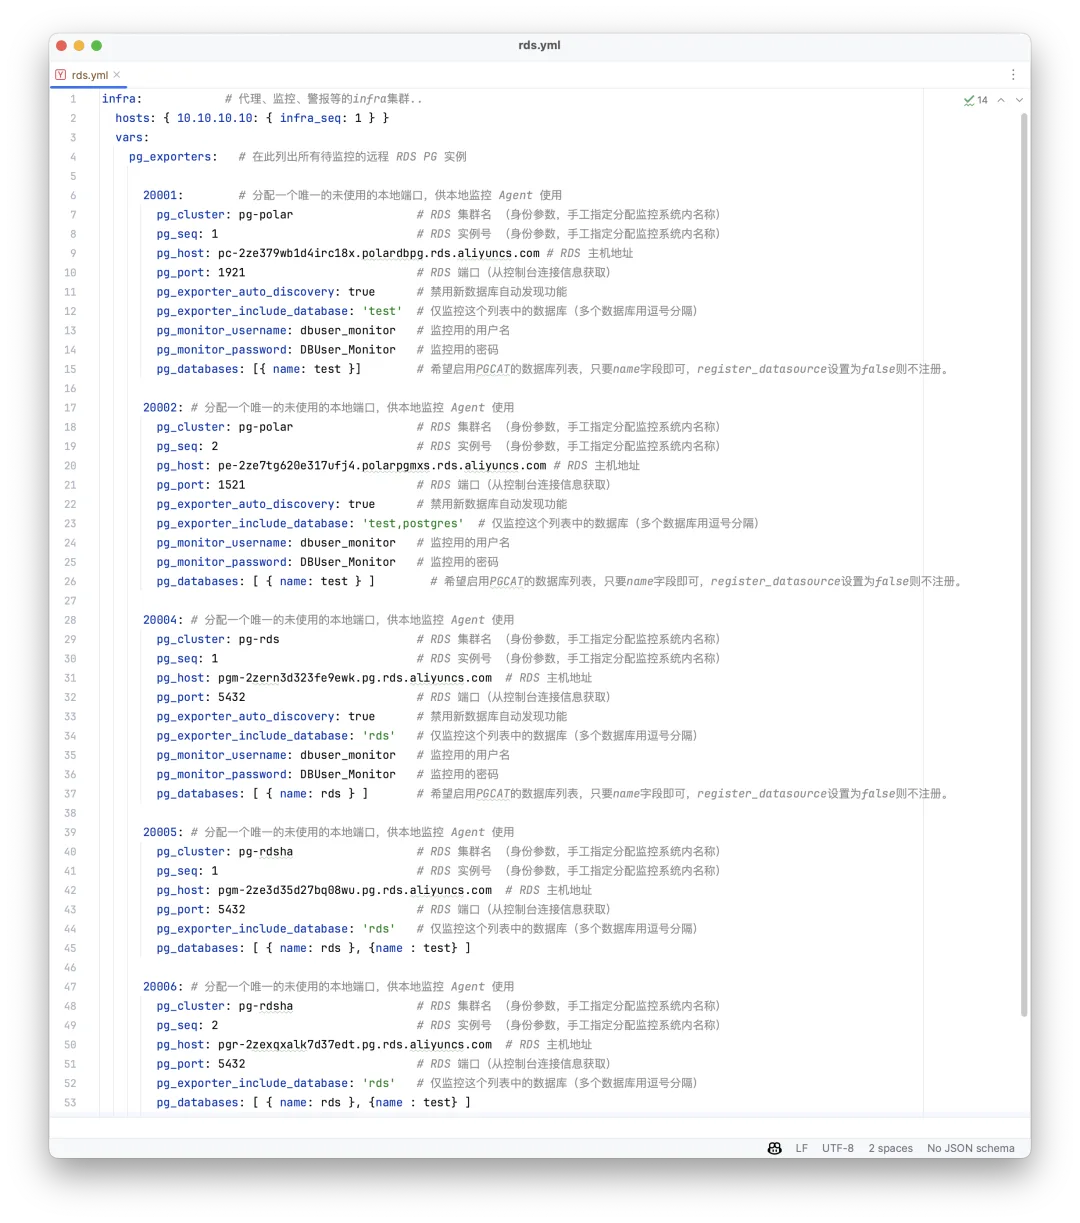
This example registered three clusters:
pg-polar: a PolarDB cluster with one primary and one replica.pg-rds: a basic, single-node RDS for PostgreSQL instance.pg-rdsha: a high-availability RDS cluster with an additional read-only node.
The screenshot shows the configuration. Usually, the fields to change were pg_cluster, pg_seq, and pg_host, plus pg_port when the port was not 5432. Other settings could be overridden as needed.
After defining the targets, add each cluster to monitoring:
The three clusters then appear in Pigsty:
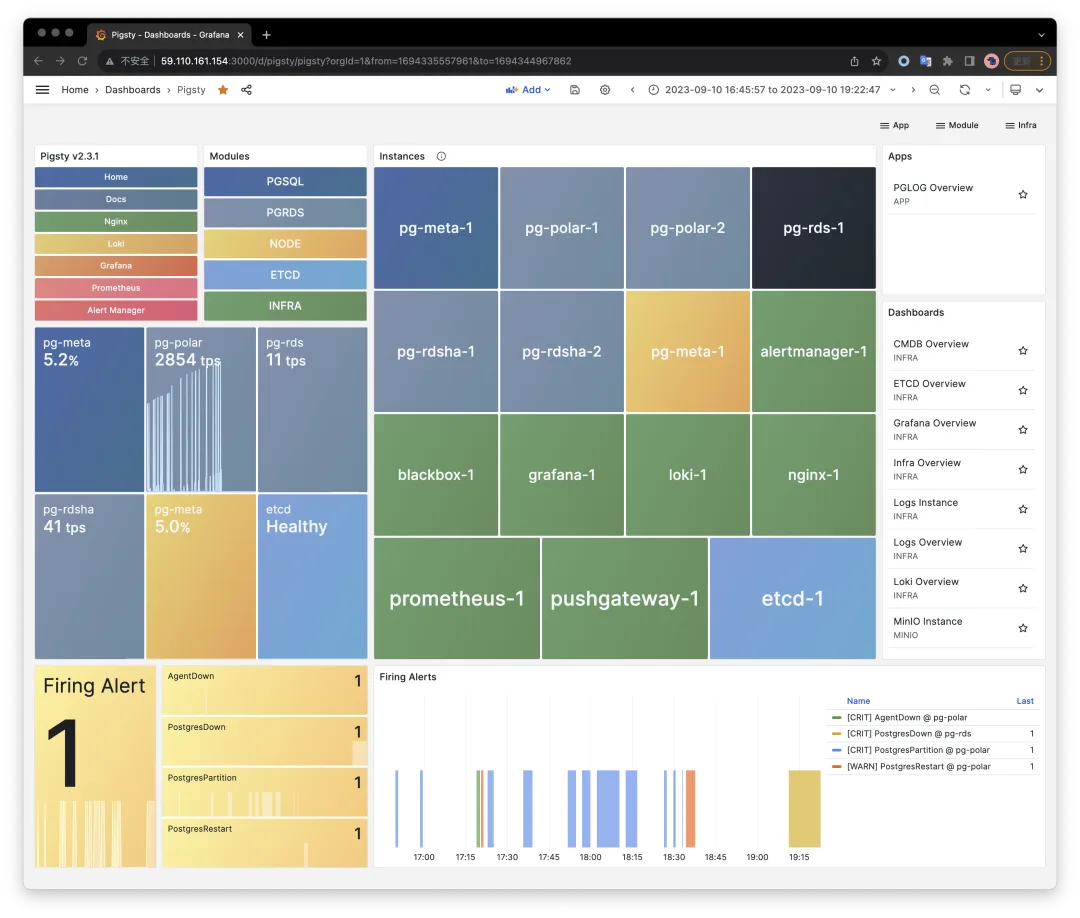
Click a cluster or instance name in light blue to open its PGRDS dashboard.
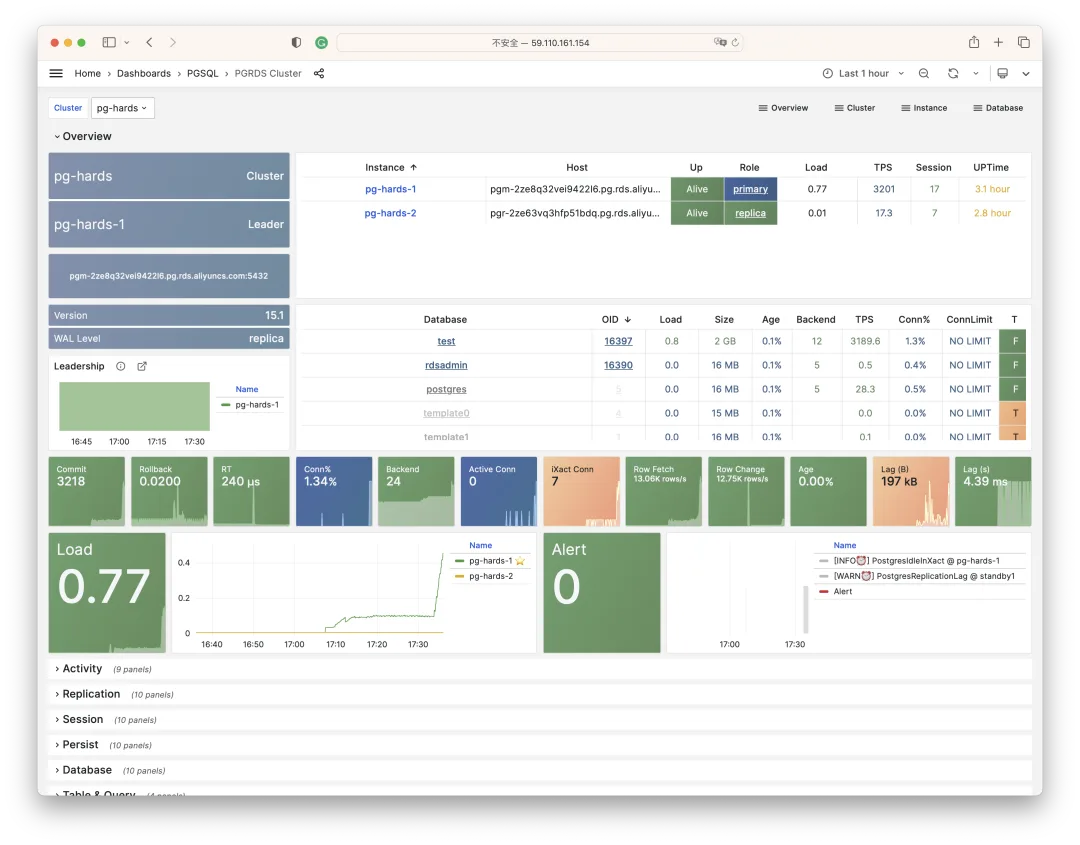
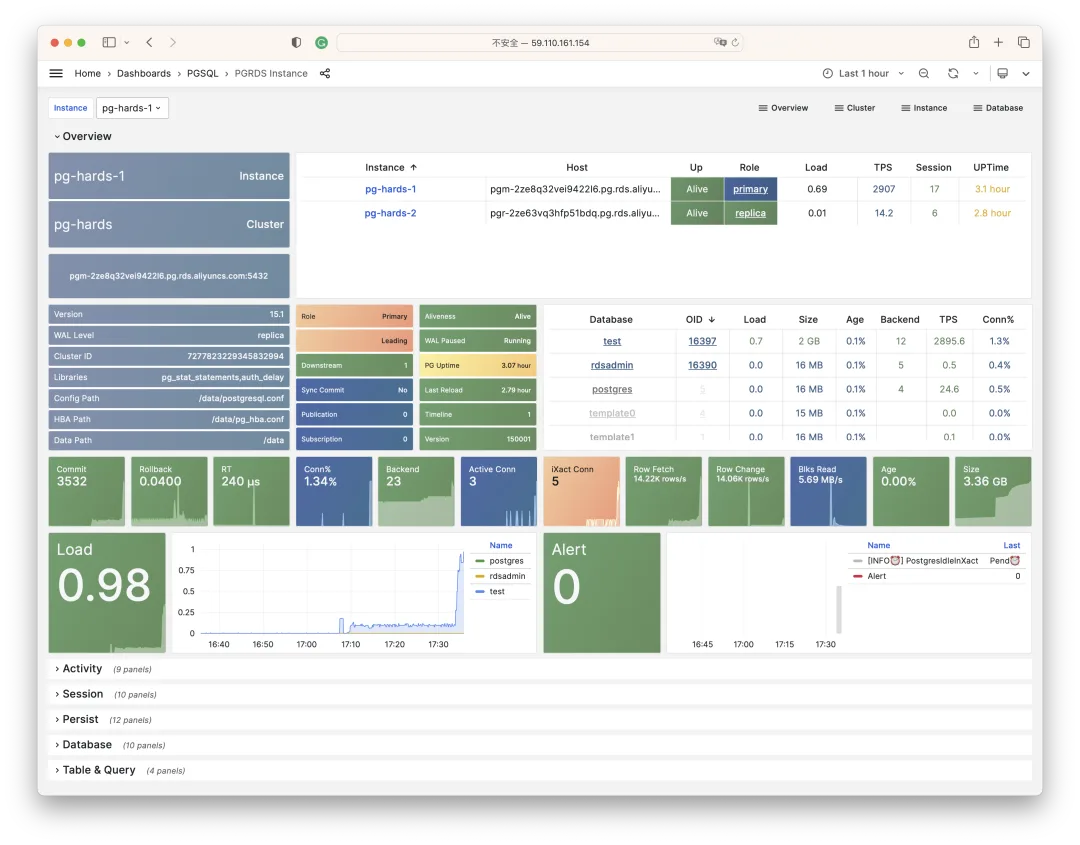
The opening screen shows cluster members, health, the database list and navigation, and 13 core metrics. Click a panel to inspect the details.

Links within charts let you move between PGRDS Cluster and PGRDS Instance, from a cluster overview to one instance and back.
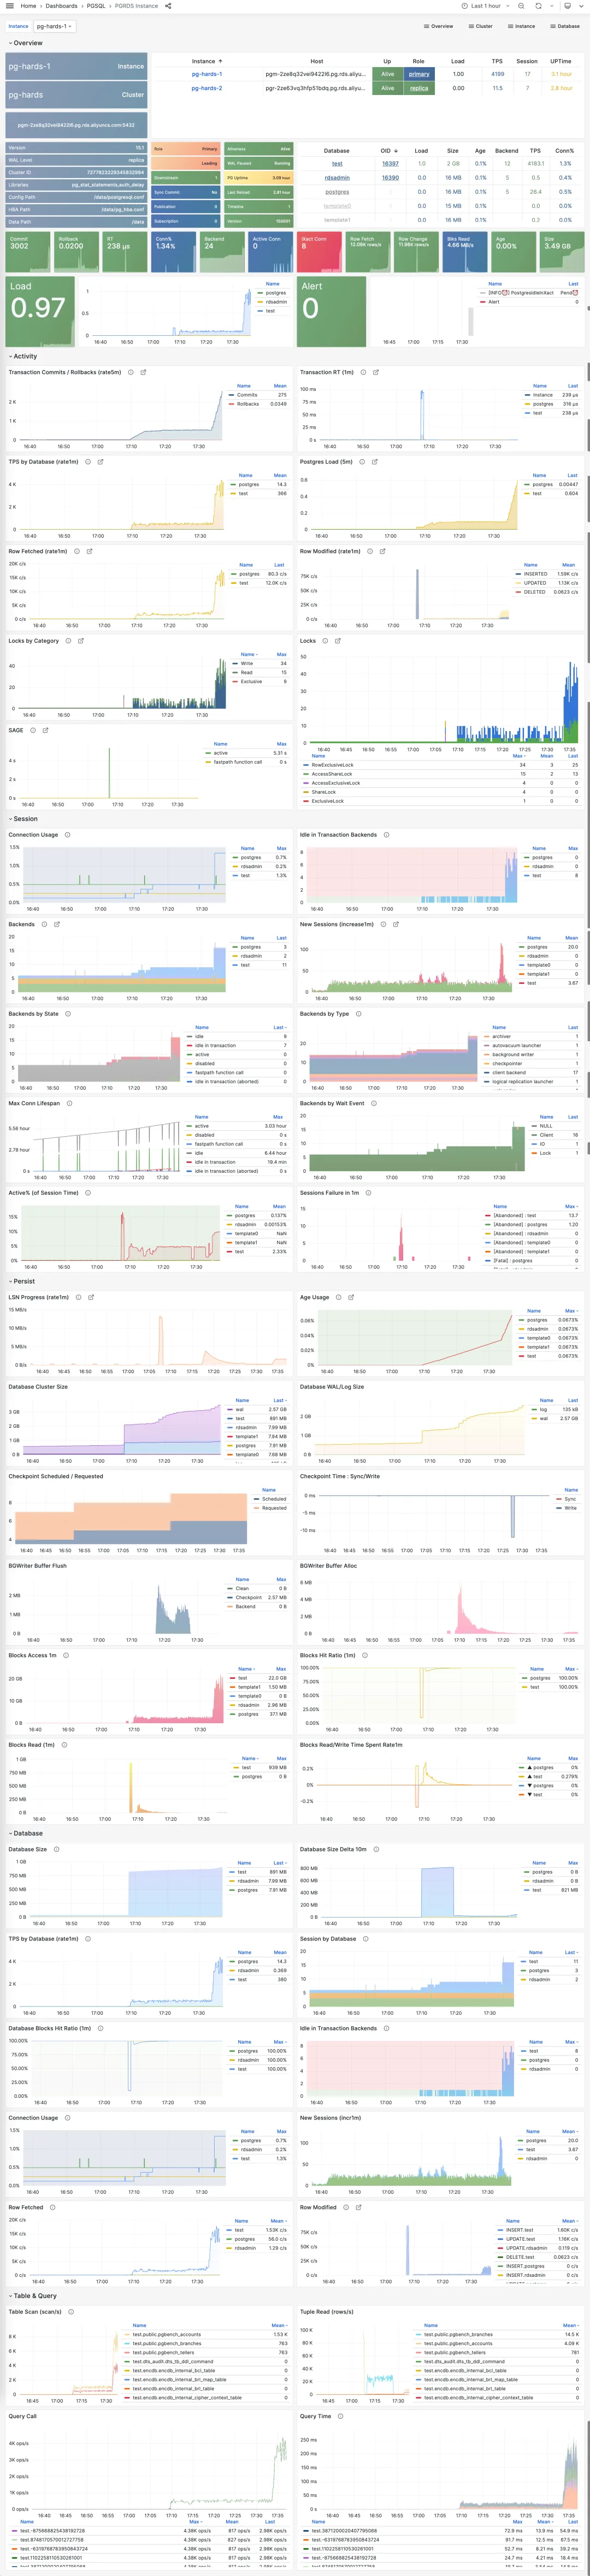
The Overview and Database dashboards remain available. They show details such as QPS and response time for each query class, or reads and writes on each table.
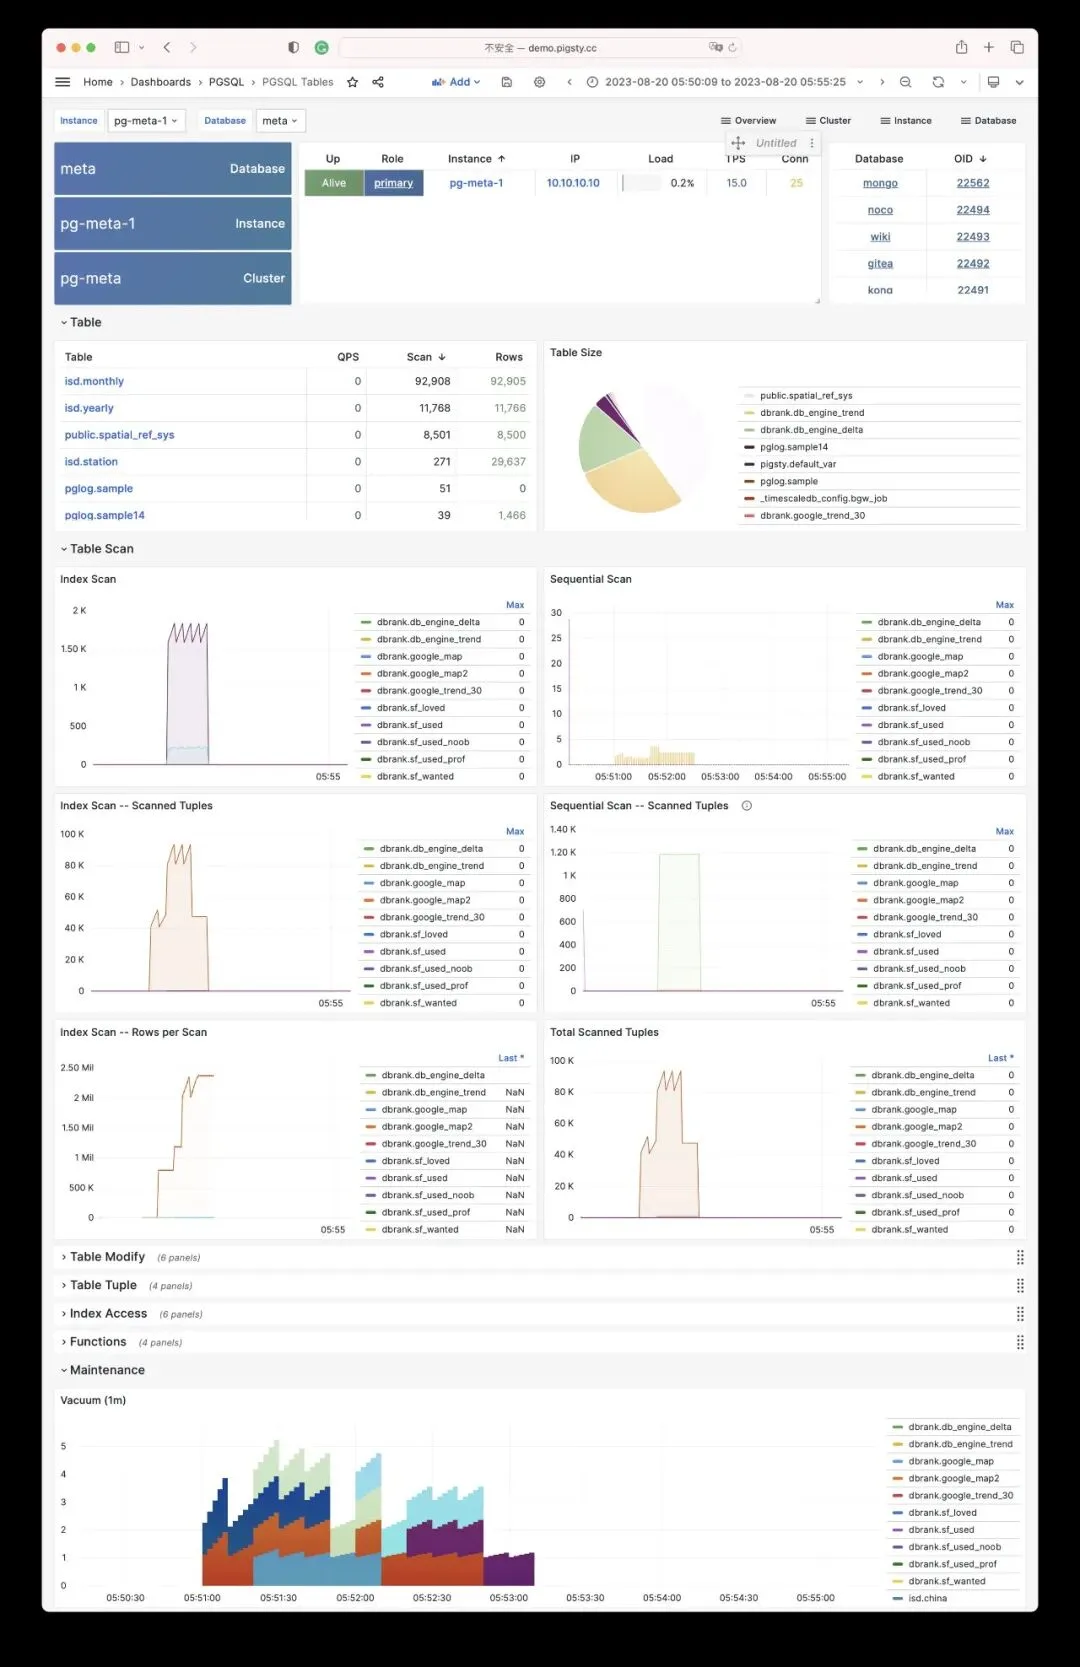
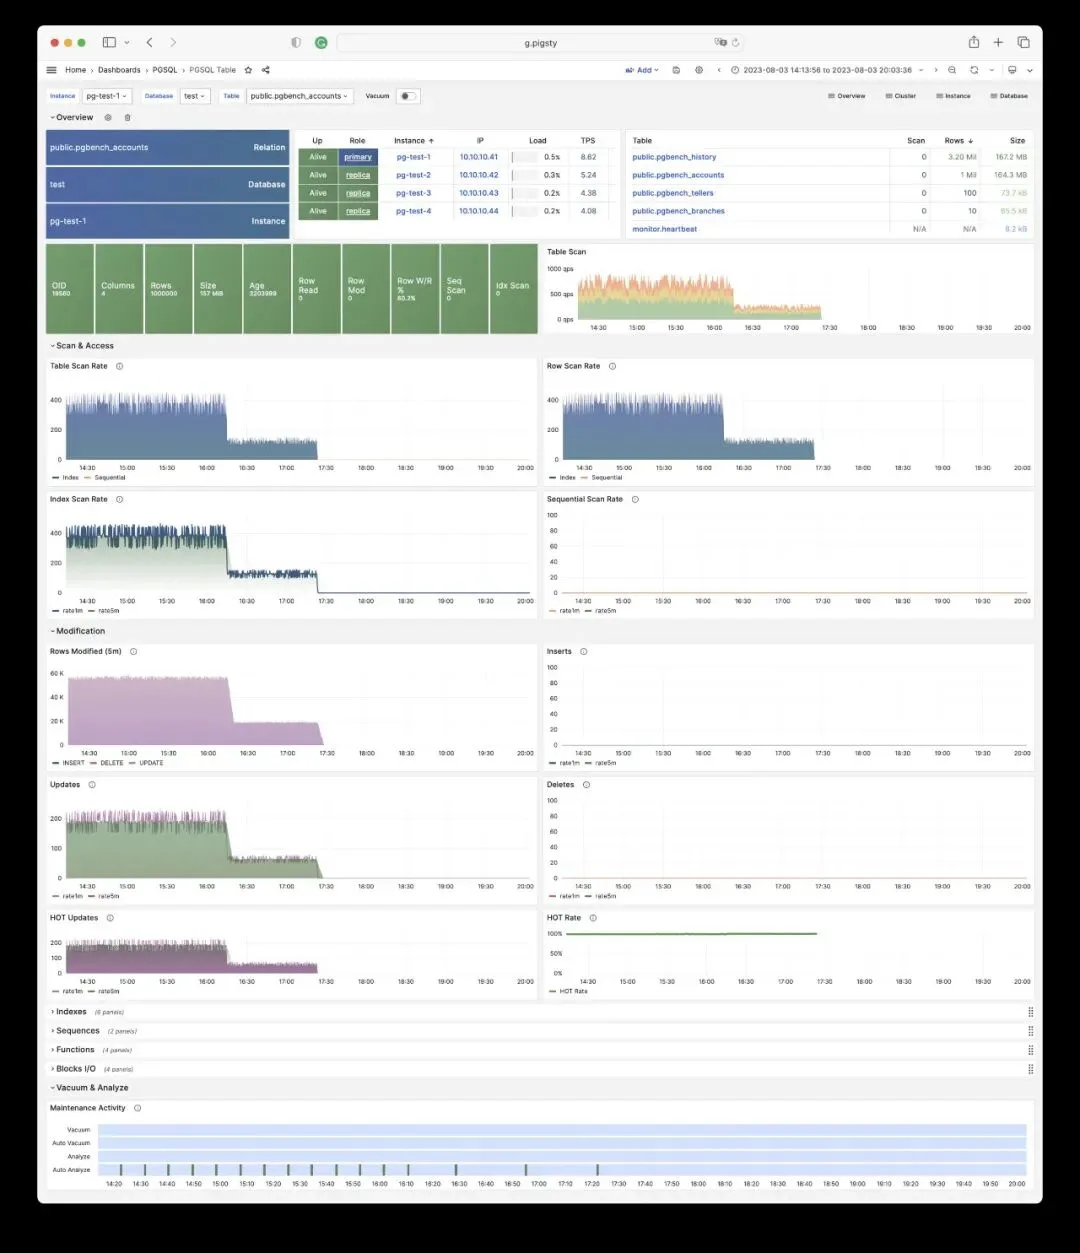
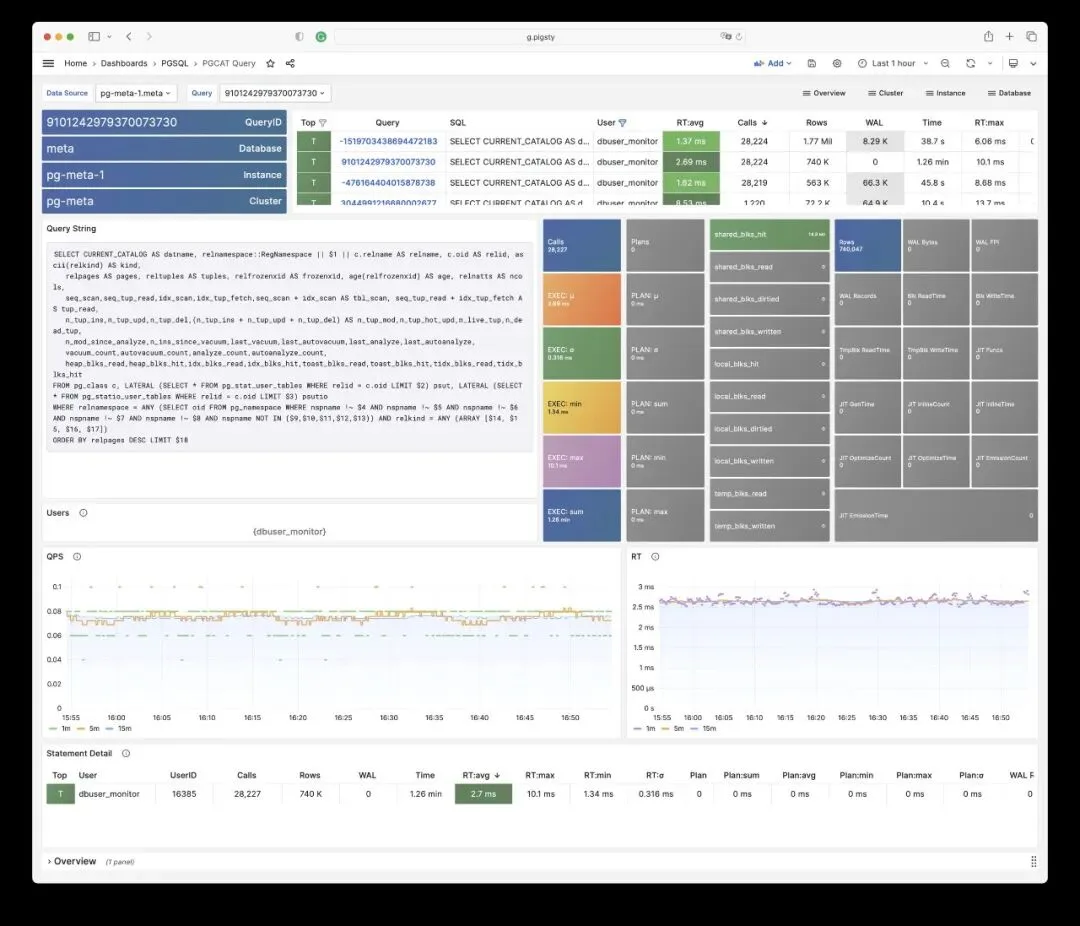
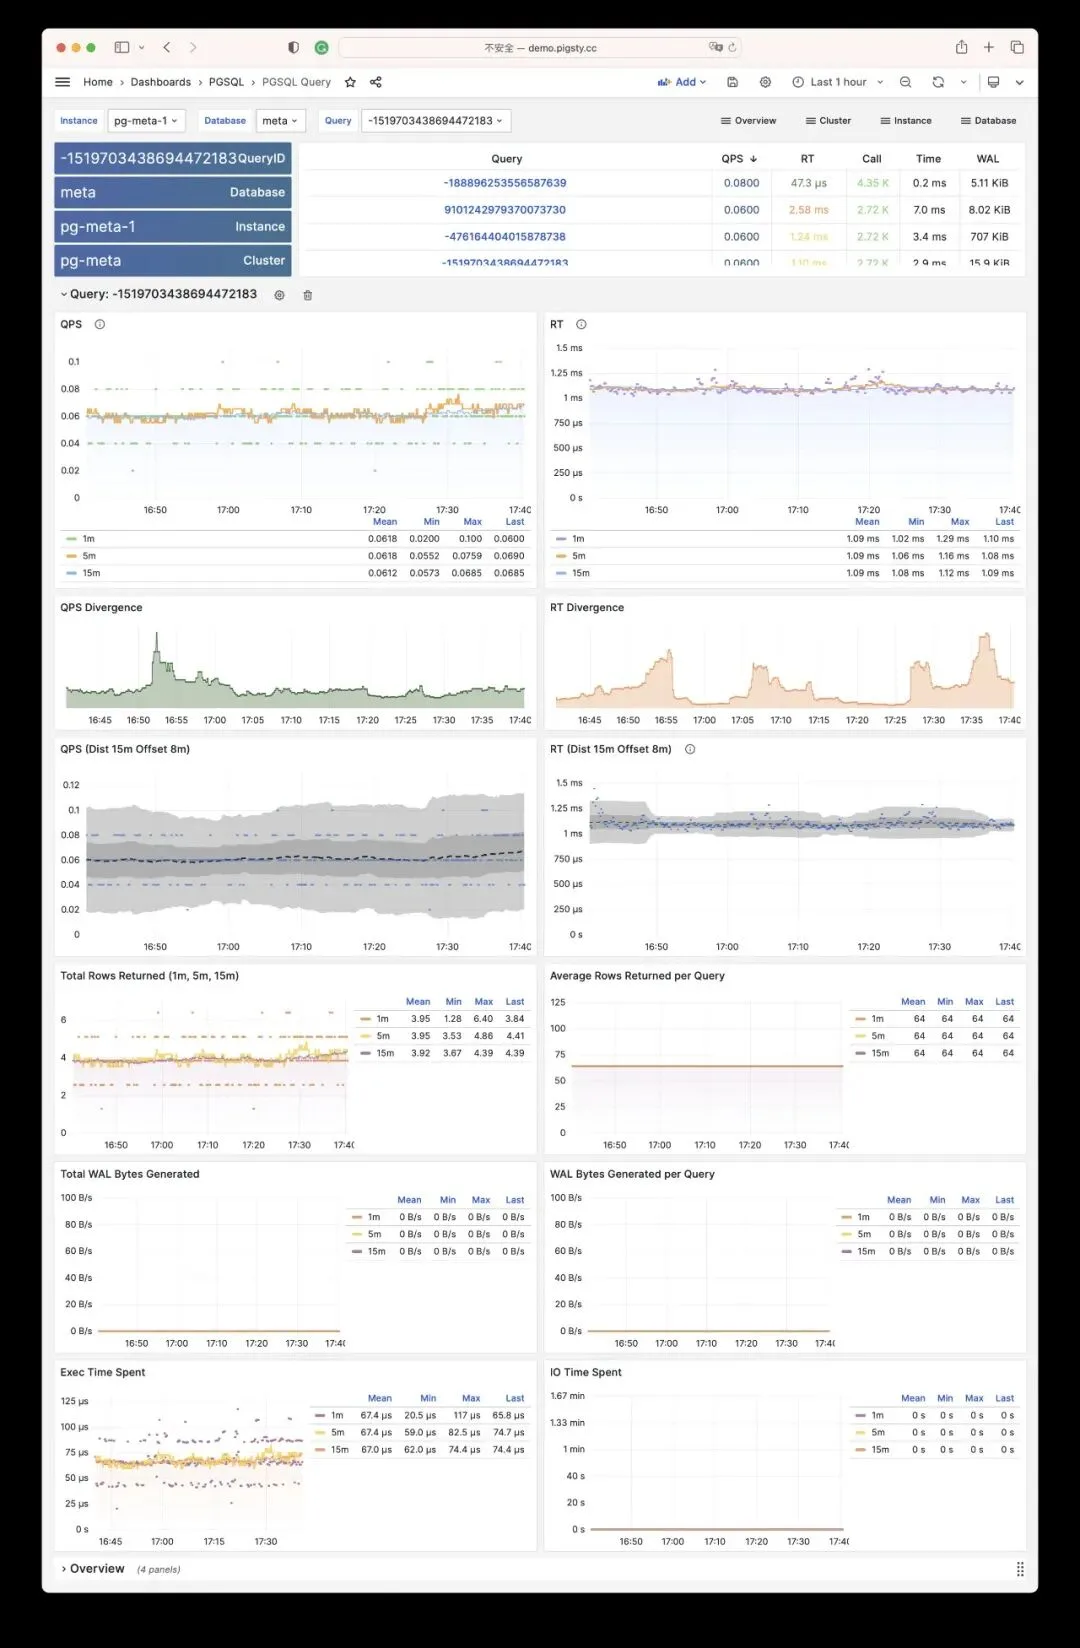
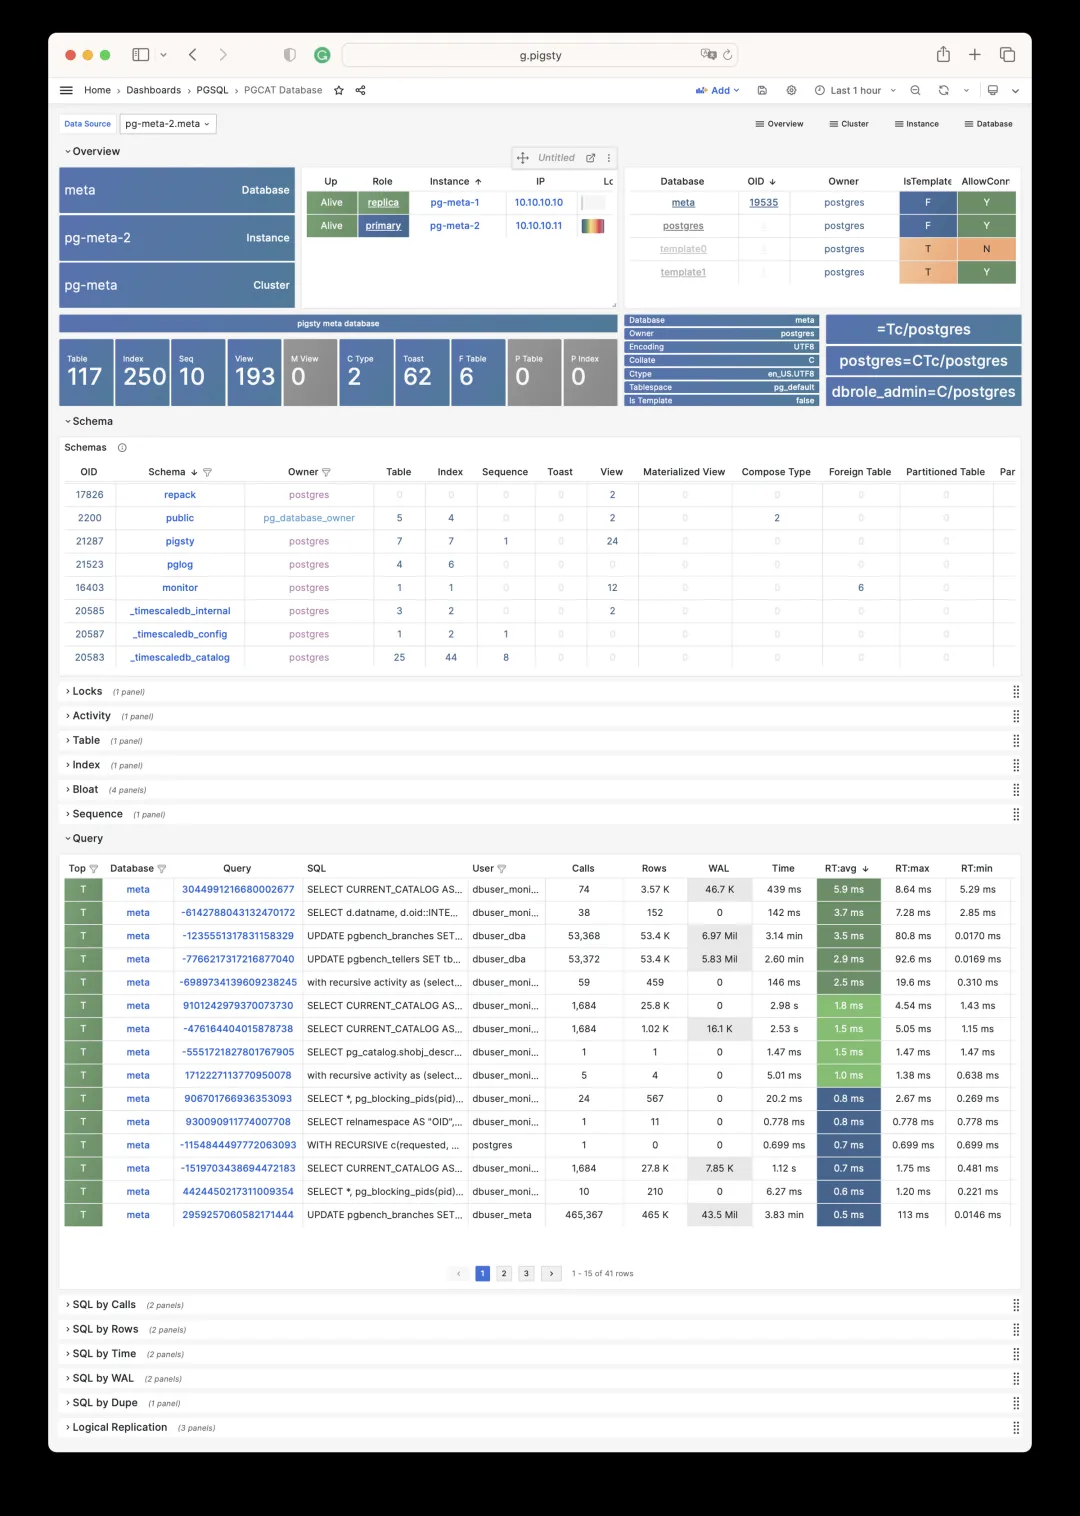
Pigsty can also query the database catalog directly through an optional data source. This provides views of current lock waits and top SQL statements.
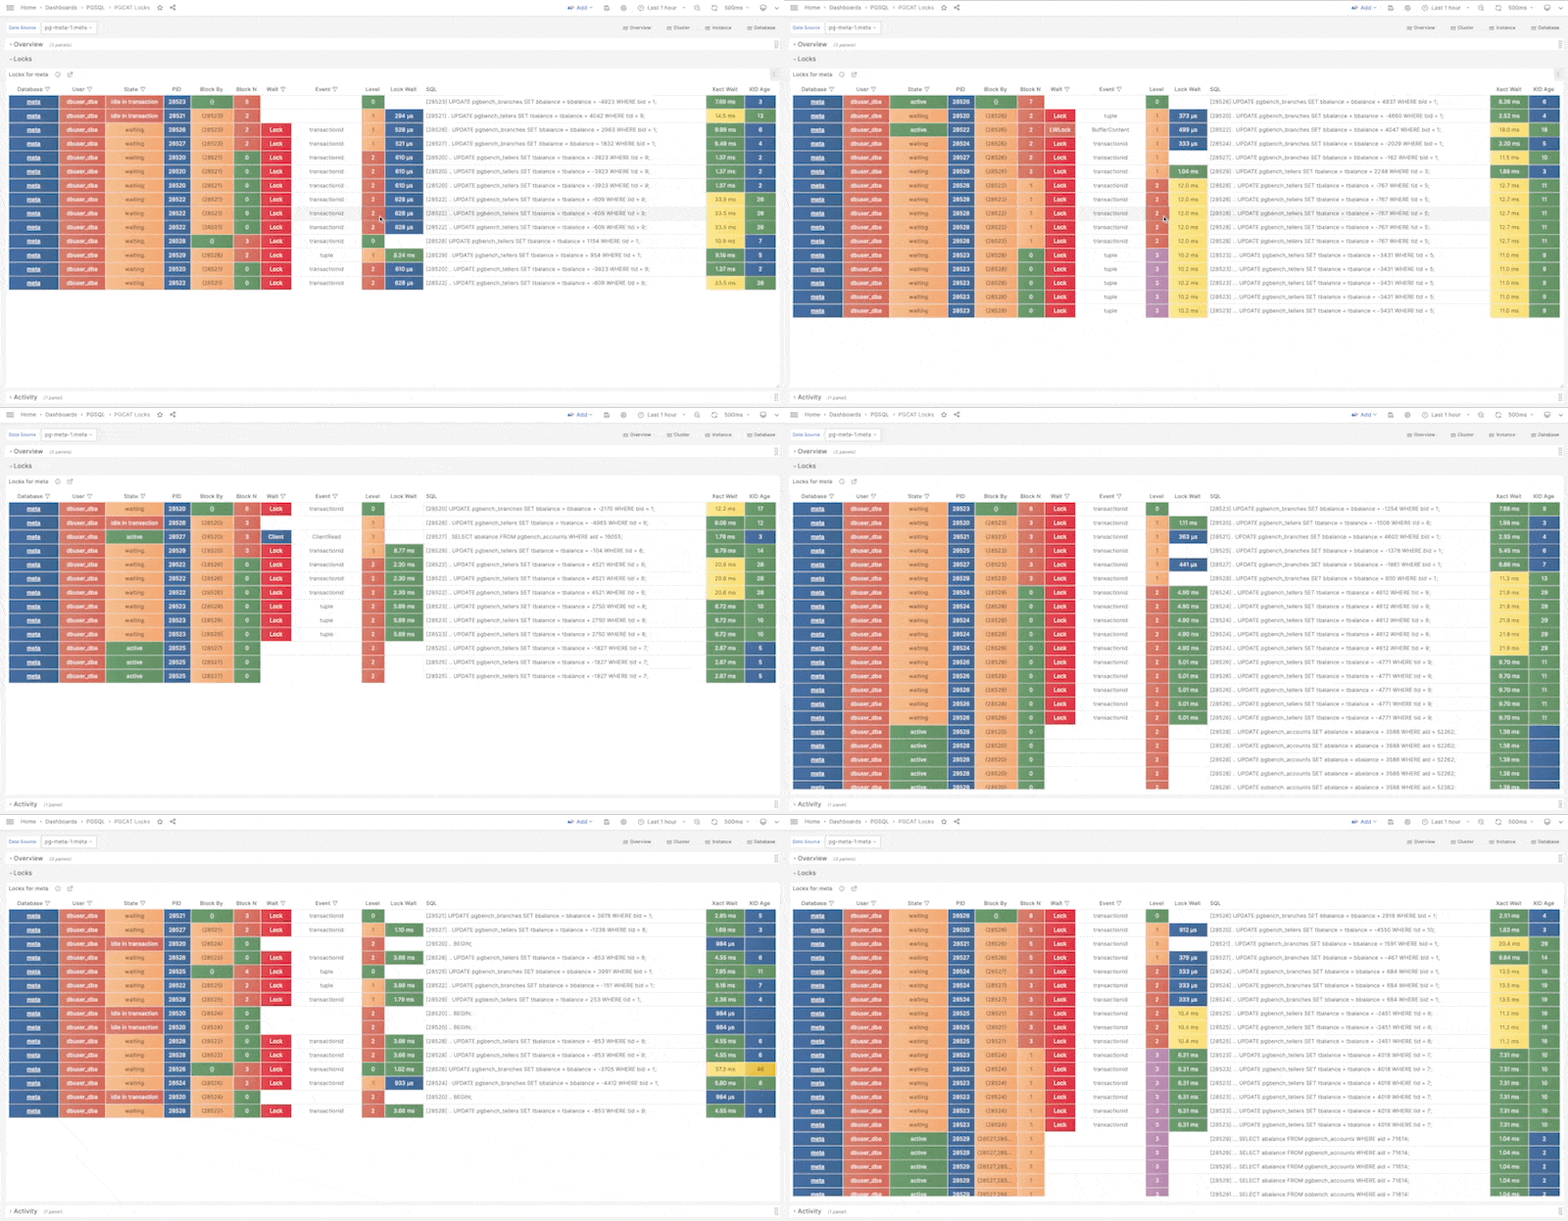
For more detail, see the Pigsty documentation, explore the demo, or watch the video tutorial.
To join the PGSQL × Pigsty discussion group, search for pigsty-cc on WeChat and contact the Pigsty assistant.