Relation Bloat Monitoring and Management
This article was written in 2018. It explains statistics-based bloat estimates and maintenance practices from that period.
PostgreSQL uses MVCC to let transactions work with different row versions. Old versions can leave tables and indexes larger than their live data requires. Routine vacuum makes space reusable; a rewrite can return excess space to the filesystem. This article explains how to measure bloat and choose when to reorganize a relation.
Relation Bloat Overview
If a relation occupies 100 GB and a compact copy would occupy 60 GB, its estimated bloat rate is (100 - 60) / 100 = 40%.
Regular VACUUM reclaims dead-tuple space for reuse within the table. It can also truncate empty pages at the end of the file. It does not compact live rows across the whole table, so free space between live pages usually remains allocated.
VACUUM FULL copies live tuples to a new file to compact the table. It holds an AccessExclusiveLock for the operation, blocking reads and writes. pg_repack allows most reads and writes to continue, but needs brief exclusive locks during setup and the final swap.
Measure bloat before choosing which relations to rewrite. Set the threshold and schedule from workload, available disk space, and maintenance windows.
Measuring Relation Bloat
Estimate the bloat rate with 1 - compact_size / actual_size. The compact size includes live tuples and necessary page, tuple, and alignment overhead.
Relation size is available from PostgreSQL. The next step is to measure or estimate the space that live tuples need.
Measuring Tuple and Free Space
pgstattuple scans a relation and reports live tuples, dead tuples, and free space.
tuple_percent uses a 0–100 scale. Thus 1 - tuple_percent / 100 is the share
outside live tuples, including necessary storage overhead. The sample calls this
value bloat, but it is not the exact fraction a rewrite can reclaim.
See the PostgreSQL 10 pgstattuple reference for field definitions and the pgstatindex function for B-tree indexes.
Two other supplied extensions help inspect relation storage:
- pg_freespacemap reports recorded free space in each page.
- pageinspect reads the contents of individual pages.
For routine monitoring, an estimate is usually enough to identify relations for closer inspection. Measuring every live tuple requires a full relation scan, which can add substantial I/O when repeated across many tables.
PostgreSQL 9.5 added pgstattuple_approx to the pgstattuple extension. It estimates some values to reduce the amount of data scanned. Its cost depends on how much of the relation must be read.
Use statistics-based estimates for frequent monitoring across many tables. Scan selected relations when you need a more precise measurement.
Estimating Bloat Rate
The estimate uses three values from table and column statistics:
- Average tuple width
avgwidth: calculated from column-level statistical data, used to estimate space occupied in compact state - Tuple count:
pg_class.reltuples: used to estimate space occupied in compact state - Page count:
pg_class.relpages: used to measure actually used space
The estimate is:
Here block_size is page size, default 8192, pageheader is header overhead, default 24 bytes. Page size minus header size gives actual space available for tuple storage. Therefore, (reltuples * avgwidth) gives estimated total tuple size, and dividing by the former gives expected pages needed to compactly store all tuples. Finally, expected page count divided by actual page count gives utilization rate, and 1 minus utilization rate gives bloat rate.
Difficulties
Estimating average tuple length requires accounting for:
- When tuples contain null values, headers will have null bitmaps
- There’s padding between headers and data sections, requiring boundary alignment consideration
- Some field types also have alignment requirements
Calculating Average Tuple Length
The diagram shows the PostgreSQL tuple layout used to estimate average tuple length.
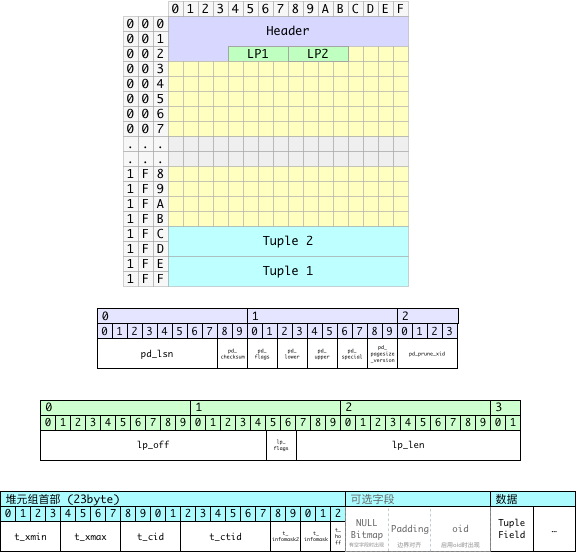
Space occupied by a tuple can be divided into three parts:
- Fixed-length line pointer (4 bytes, strictly speaking this isn’t part of the tuple, but it corresponds one-to-one with tuples)
- Variable-length header
- Fixed-length part 23 bytes
- When tuples contain null values, a null bitmap appears, with each field occupying one bit, so its length is the number of fields divided by 8, rounded up
- After the null bitmap, padding is needed to
MAXALIGN, usually 8 - If the table has the
WITH OIDSoption enabled, tuples also have a 4-byte OID, but we don’t consider this case here
- Data section
Therefore, a tuple’s average length (including corresponding line pointer) can be calculated as:
The key is finding average header length and average data section length.
Calculating Average Header Length
The main variables in average header length are null bitmap and padding alignment. To estimate average tuple header length, we need several parameters:
- Average header length without null bitmap (with padding):
normhdr - Average header length with null bitmap (with padding):
nullhdr - Proportion of tuples with null values:
nullfrac
Estimate average header length with:
Since headers without null bitmaps are 23 bytes long, aligned to 8-byte boundaries gives 24 bytes, the above formula becomes:
To round a length up to an 8-byte boundary, use:
Calculating Average Data Section Length
Average data section length mainly depends on each field’s average width and null rate, plus trailing alignment.
The following SQL can calculate average tuple data section width for all tables using statistical information:
For example, this SQL can get average tuple length for table app.apple from the pg_stats system statistics view:
max(null_frac) is an approximation for the fraction of rows with any NULL.
Column statistics do not describe how NULL values overlap across columns.
Integration
The function below combines those estimates. It assumes 8-byte alignment and uses the server’s block size. It returns NULL when statistics are unavailable. It estimates heap space only; TOAST, fillfactor, and column alignment can affect the result.
Batch Calculation
For database-wide monitoring, a view can estimate many relations from catalog statistics. This separate example estimates B-tree index bloat:
In the original 3 TB database, this view took about 50 ms. It reads catalog statistics rather than scanning every index page. Catalog access and relation-size lookups still have a cost, and stale or incomplete statistics affect the estimate. The result is a screening tool for candidate indexes.
Handling Table Bloat
Use VACUUM FULL when a maintenance window allows exclusive table access. For
online reorganization, pg_repack reduces the duration of exclusive locking.
The original PostgreSQL 10 environment used the PGDG package below. Select the package built for your PostgreSQL major version:
Using pg_repack
pg_repack uses the usual PostgreSQL client connection parameters.
Before using pg_repack, you need to create the pg_repack extension in the database to be reorganized:
Example commands:
-T controls lock waiting, not total runtime. Without --no-kill-backend,
pg_repack can cancel and later terminate conflicting sessions. A full-table
repack needs a primary key or a suitable unique index on NOT NULL columns. See
the option reference.
pg_repack Strategy
Schedule pg_repack during low-traffic periods. It consumes CPU, disk I/O, and extra storage, and can increase query latency and replication lag.
For example, select candidate tables during a low-traffic period. The following
view supplies the columns used by the scheduling example; total_mb measures
current disk usage in MiB, including indexes and TOAST:
The shell functions return one table name per line and accept table names as separate quoted arguments:
These size thresholds use current disk usage, including the table, indexes, and TOAST:
- From small tables < 256 MiB with bloat rate > 40%, select TOP64
- From medium tables 256 MiB to 1 GiB with bloat rate > 30%, select TOP16
- From large tables 1 GiB to 4 GiB with bloat rate > 20%, select TOP4
This example reorganizes selected tables during the early-morning low-traffic period and handles tables whose total disk usage exceeds 4 GiB manually. Adjust the schedule to your workload.
pg_repack Principles
pg_repack builds a compact copy and records concurrent changes with a trigger.
After replaying those changes, it swaps storage through the system catalogs.
Index-only repacks build a replacement index concurrently, then swap and drop the
old index.
Reorganizing Tables
- Create an empty table with the same schema as the original table but without indexes
- Create a log table corresponding to the original table to record changes that occur on that table during
pg_repackoperation - Add a row trigger to the original table to record all
INSERT,DELETE,UPDATEoperations in the corresponding log table - Copy data from the old table to the new empty table
- Create the same indexes on the new table
- Apply incremental changes from the log table to the new table
- Swap table, index, and TOAST storage through the system catalogs
- Drop the old storage
Reorganizing Indexes
- Use
CREATE INDEX CONCURRENTLYto create a new index on the original table, maintaining the same definition as the old index - Swap the old and new indexes in the system catalogs
- Delete the old index
pg_repack Operating Checks
- Schedule around long transactions and conflicting maintenance. Inspect lock waits before deciding whether to cancel a session.
- Budget disk for the replacement table, indexes, and change log. The project recommends free space of about twice the table-and-index size for a full repack.
- Monitor WAL volume, replica replay lag, and free disk space throughout the copy and index build. WAL is generated during the operation, not just at the final swap.
- After interruption, inspect the installed version’s cleanup guidance and the remaining objects before retrying. Temporary-object names and cleanup behavior vary by version.
See the pg_repack requirements and implementation notes when planning the operation.